Figure 2.
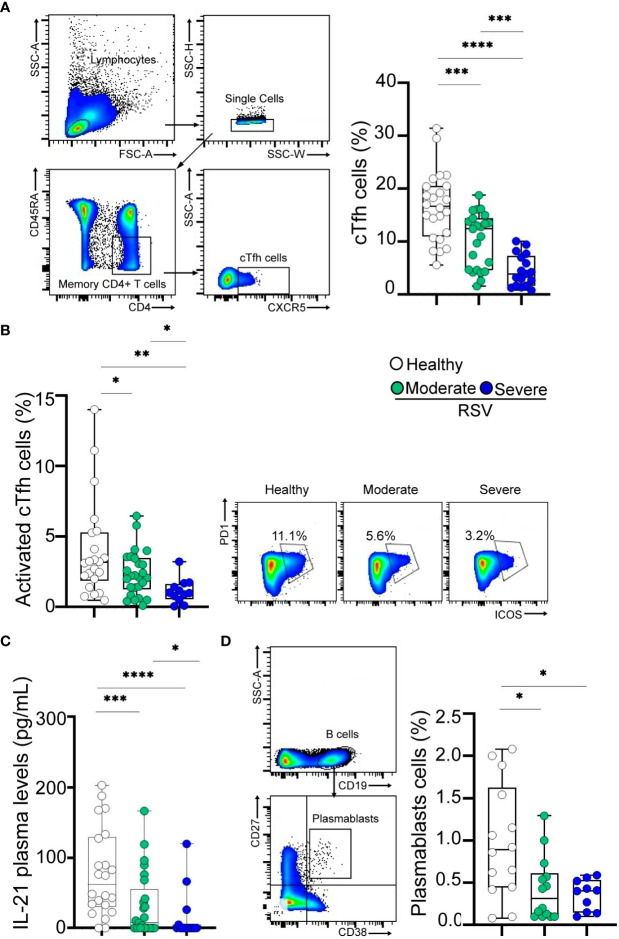
Frequency of cTfh cells and plasmablasts in RSV and healthy children. (A) Left: Gating strategy of cTfh cells defined as CD4+CD45RA-CXCR5+ cells. Right: Frequency of cTfh cells in healthy children (n=24) and RSV children (moderate, n=25 and severe, n=17) analyzed by flow cytometry. (B) Left: Frequency of activated cTfh cells defined as CD4+CD45RA-CXCR5+PD-1+ICOS+ cells in healthy children (n=21) and RSV children (moderate, n=25 and severe, n=11) analyzed by flow cytometry. Right: Representative dot plots of a donor from each cohort is shown. (C) Plasma levels of IL-21 in healthy children (n=22) and RSV children (moderate, n=25 and severe, n=15) quantified by ELISA. (D) Left: Gating strategy for plasmablasts is shown. Right: Frequency of plasmablasts defined as CD19+CD27hiCD38hi cells in healthy children (n=14) and RSV children (moderate, n=14 and severe, n=10) analyzed by flow cytometry. Median and min to max of n donors are shown in A (right), B (left), C, D (right). P values were determined by Kruskall-Wallis test followed by Dunn’s multiple comparison test and Mann-Whitney U test. *p<0.05, ** p<0.01, *** p<0.001, ****p<0.0001. Moderate (green circle), severe (blue circle), healthy (white circle).

