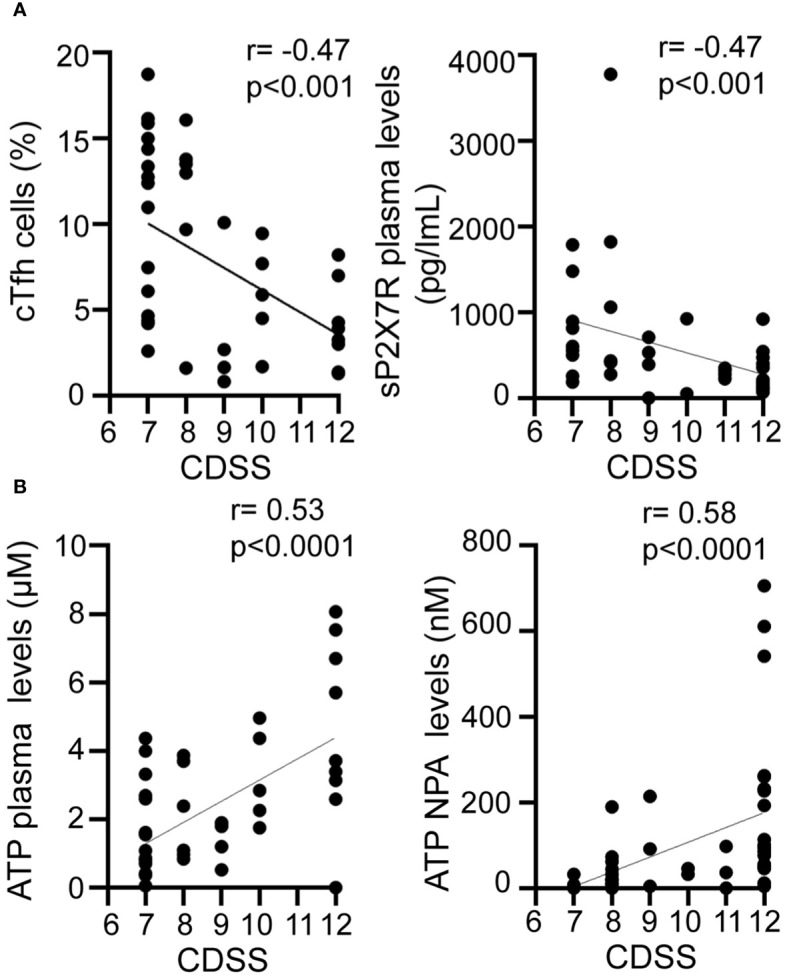
Figure 5.

Relationship between disease severity and cTfh and purinergic signaling components. Graphs showing correlations between CDSS and frequency of cTfh cells (A left), P2X7R soluble form plasma level (A right), plasma ATP level (B left), NPA ATP level (B right) of RSV infected children (n=42). Spearman correlation test. CDSS, clinical disease severity score.
