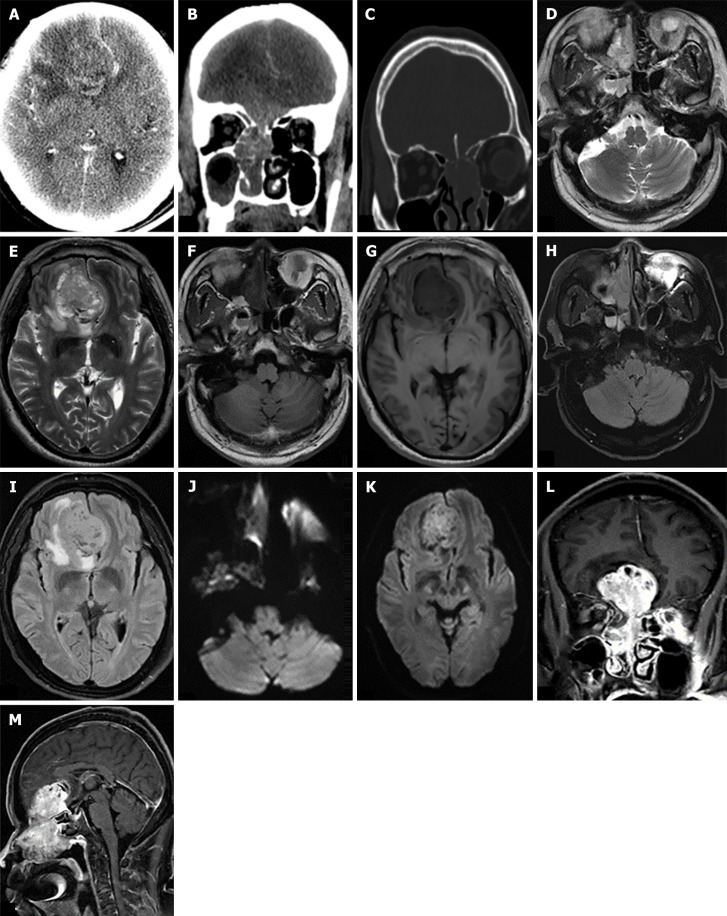
Figure 3.
Computed tomography and magnetic resonance imaging scan images. A: Axial enhanced computed tomography (CT) scan revealed an irregularly enhanced tumor resembling a mass in the right frontal region; B: Coronal enhanced CT scan revealed a polypoid mass with expansive growth in the right nasal cavity, extending intracranially across the cribriform plate; C: Sagittal CT bone window revealed multiple bone destruction in bilateral skull base and ethmoid sinus wall; D-K: Magnetic resonance imaging (MRI) scan reveals a mass-like abnormal signal in the right nasal cavity and right frontal region, characterized by slightly increased signal intensity on T2-weighted images, slightly decreased signal intensity on T1-weighted images, unevenly slightly increased signal intensity on FLAIR images, and slightly increased signal intensity on diffusion-weighted imaging. There is hyperintensity in the frontal lobe adjacent to tumor (vasogenic edema/infiltration); L and M: The enhanced MRI scan revealed a diffusely heterogeneous mass with enhanced contrast in the right nasal cavity, infiltrating into the cranial cavity beyond the cribriform plate.

