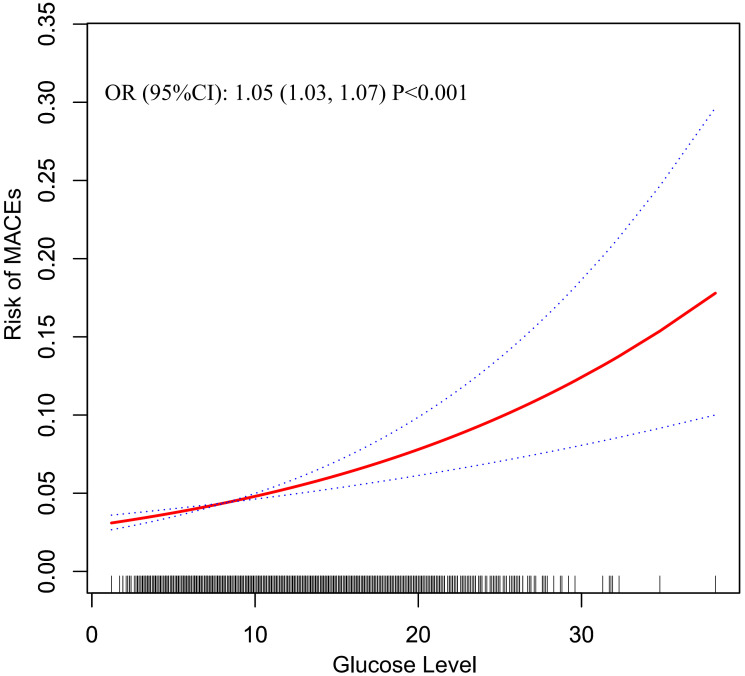
Fig. 1.
Estimated risk of MACEs in different blood glucose levels for total participants. The solid red line was the estimated risk, and the dashed lines above and below were the upper and lower limits of 95% CI, respectively. All covariates in model 3 were adjusted. MACEs, major adverse cardiovascular events; OR, odds ratio; CI, confidence interval.

