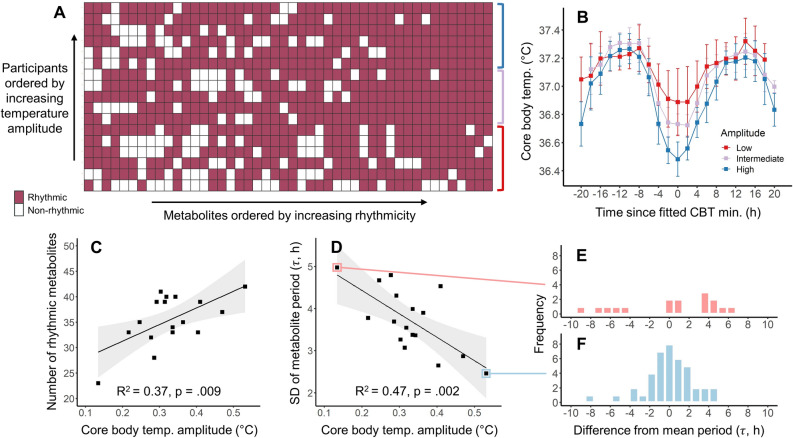
Figure 1.
(A) Circadian metabolites that were significantly rhythmic for each participant. Rows represent the 17 participants, ordered by core body temperature amplitude, and columns represent the 46 circadian metabolites, ordered by number of significantly rhythmic instances across participants. (B) Core body temperature, split by tertiles into low (red; N = 6), moderate (purple; N = 5), and high (blue; N = 6) circadian amplitude. Color groupings map to rows indicated by the colored brackets in panel A. Points and error bars represent mean and standard deviation of core body temperature within 2-h bins relative to core body temperature minima. (C) Higher core body temperature amplitude was associated with a greater number of rhythmic circadian metabolites. (D) Higher core body temperature amplitude was associated with lower within-individual variability in metabolite periods. Linear models (black line) and corresponding 95% confidence intervals (gray shading) are shown for both associations. Variability in the metabolite period distribution is shown for the participants with the lowest (E) and highest (F) core body temperature amplitudes, plotted as the difference in period for each rhythmic metabolite from each participant’s mean metabolite period.

