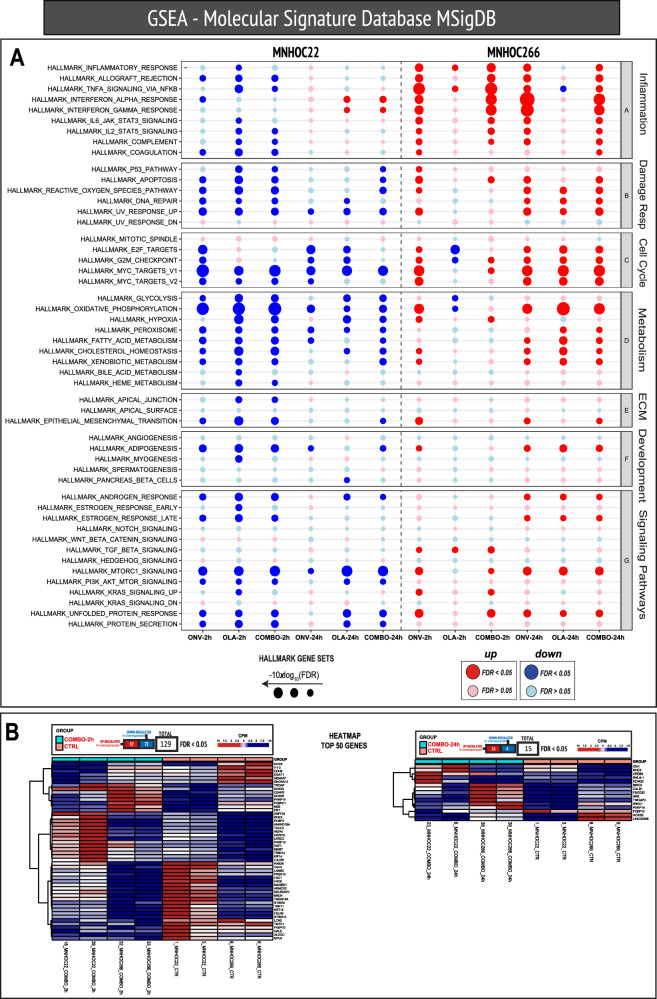
Fig. 5. Differential transcriptomic analysis.
A Dot plots of Hallmark gene sets indicating the regulation of the indicated pathways organized by the process. Each column represents the comparison listed at the bottom in the respective models. The size of each dot corresponds to the level of significance, whereby larger dots indicate greater significance of the gene set enrichment. The color of the dots represents the type of regulation: red for upregulation and blue for down-regulation. Only darkly colored dots are considered statistically significant, whereas dots with lighter colors are not statistically significant. B Heatmap of the significant genes of the ‘COMBO_2h vs CTR’ and ‘COMBO_24h vs CTR’ comparisons, respectively, considering the two models together.

