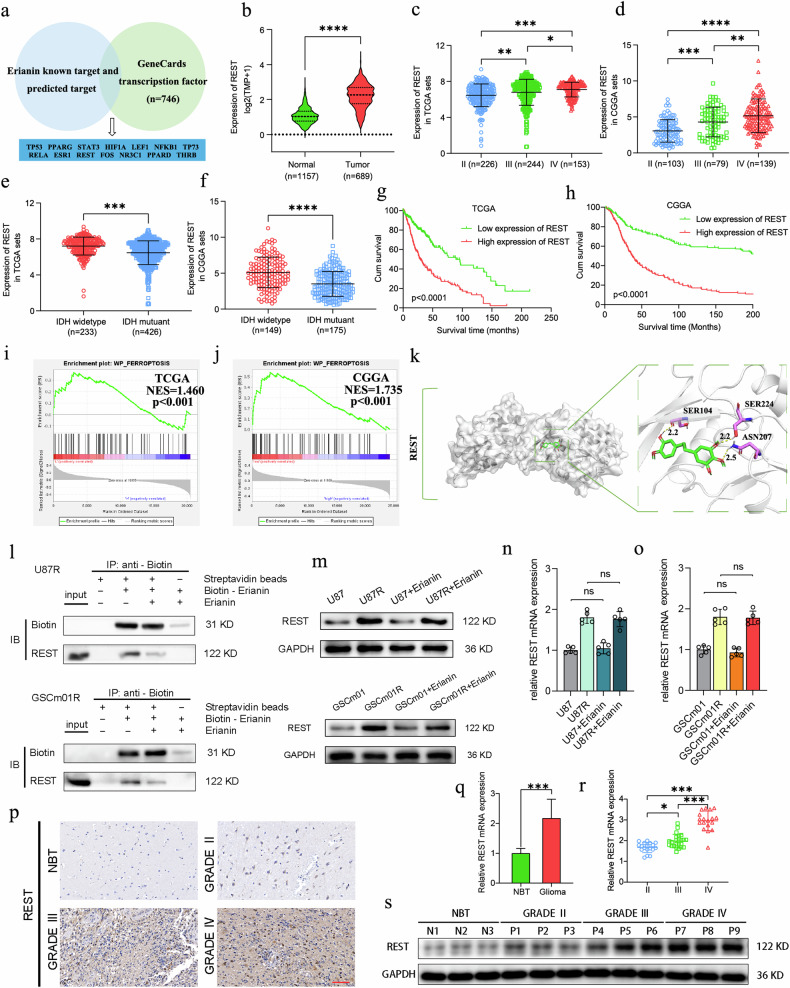
Fig. 5. REST is the target of erianin, overexpressed in glioma and correlating with poor patient prognosis.
a Venn chart for downstream target screening of erianin. b REST expression correlated with NBT and glioma based on GTEX and TCGA datasets. c, d REST expression correlated with glioma WHO grades based on TCGA and CGGA datasets. e, f REST expression correlated with glioma IDH mutation based on TCGA and CGGA datasets. g, h Kaplan–Meier survival analysis for glioma patients with high and low REST expression based on TCGA and CGGA datasets. i, j GSEA analysis of the correlation between REST expression and ferroptosis pathways in TCGA and CGGA databases. k Molecular Docking showing REST as the most likely predicted target of erianin. l U87R and GSCm01R cell lysates were incubated with biotin-erianin in the absence or presence of a 10 fold excess of unlabeled erianin, followed by pull-down with streptavidin-agarose. The precipitates were resolved by SDS-PAGE, and the gel was detected by western blotting. Western blot and qPCR assays showed REST protein expression (m) and mRNA expression (n, o) before and after erianin treatment. q, r qPCR assays showing mRNA expression of REST in glioma tissues (n = 70) and normal brain tissues (n = 10) (l), and in different WHO-grade glioma tissues (m). p, s Western blotting (n) and immunohistochemistry assays (o) showing REST expression in different WHO-grade glioma tissues. Scale bar = 50 μm. All data are shown as the mean ± SD (three independent experiments). *p < 0.05; **p < 0.01; ***p < 0.001.

