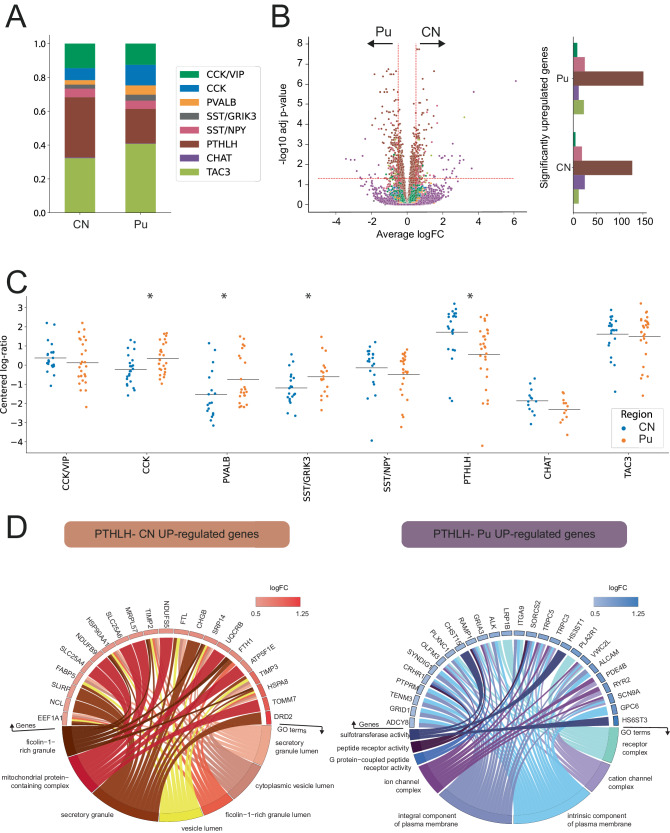
Fig. 2. Striatal interneuron classes exhibit region-specific differences.
A Barplot illustrating the different proportions of interneuron subclasses in CN and Pu. B (left) Volcano plot showing differentially expressed genes (DEGs) for each subclass. DEGs with an adjusted p-value < 0.05 (likelihood ratio test, Benjamini-Hochberg correction) and an average logFC > 0.5 were selected. (right) Barplot indicating the number of significantly upregulated genes per interneuron class on each region with bars colored following the same color scheme as the legend in panel (A). C Scatter dot plot representing the compositional analysis of interneurons in CN vs Pu (estimated by centered log-ratio method) and demonstrating significant compositional differences between CN and Pu in CCK (p = 0.008), PVALB (p = 0.015), SST/GRIK3 (p = 0.027), and PTHLH (p = 0.001) interneurons (two-sided Wilcoxon test). D Circos plots showing the GO-term enrichment analysis of upregulated genes in PTHLH subpopulation in CN (left) and Pu (right). Each GO circos plot illustrates enriched terms (adjusted p-value < 0.05, hypergeometric test, Benjamini–Hochberg correction) with their respective enriched genes along with the logFC of these genes. * p < 0.05. CN caudate nucleus, Pu putamen.

