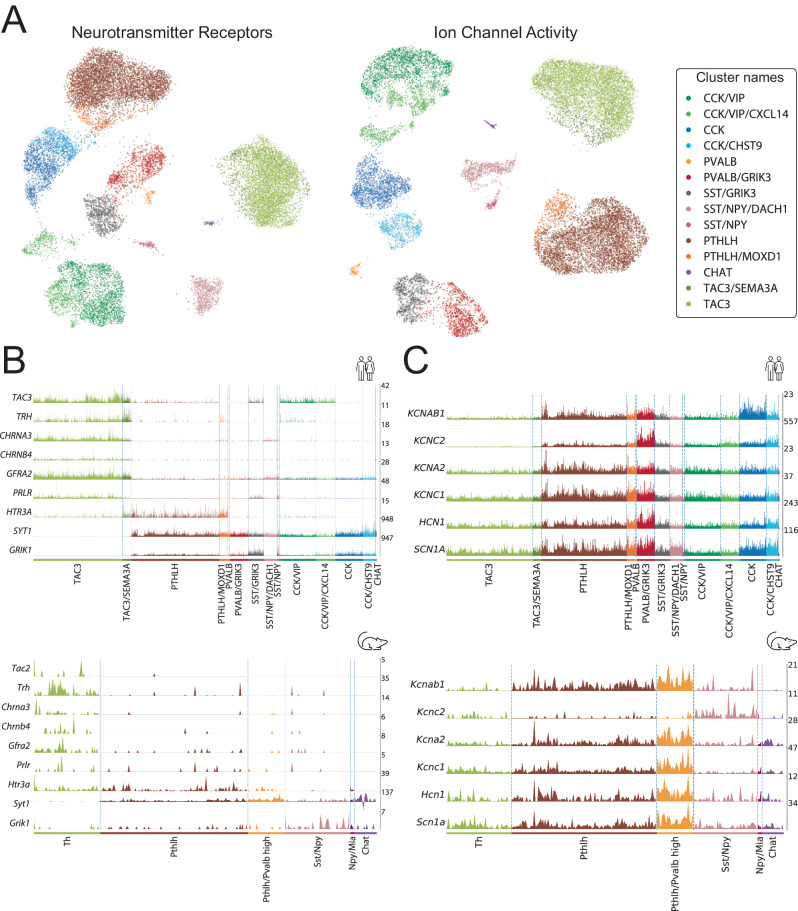
Fig. 5. Comparison of striatal interneuron subclasses between mouse and human.
A (left) UMAP of the interneuron nuclei using expression data restricted to neurotransmitter receptor genes. (right) UMAP of the same data restricted to the genes annotated with the molecular function “ion channel activity” (GO:0005216). Colored based on the interneuron classification established before. B (top) Expression of raw values of genes suggesting parallelisms between the TAC3 subclass in the present human dataset and (bottom) the Th interneurons in the mouse striatum described by Muñoz-Manchado et al. 28. C (top) Expression values of genes related to the fast-spiking phenotype in this human striatal dataset vs. (bottom) the striatal mouse dataset from Muñoz-Manchado et al. 28.

