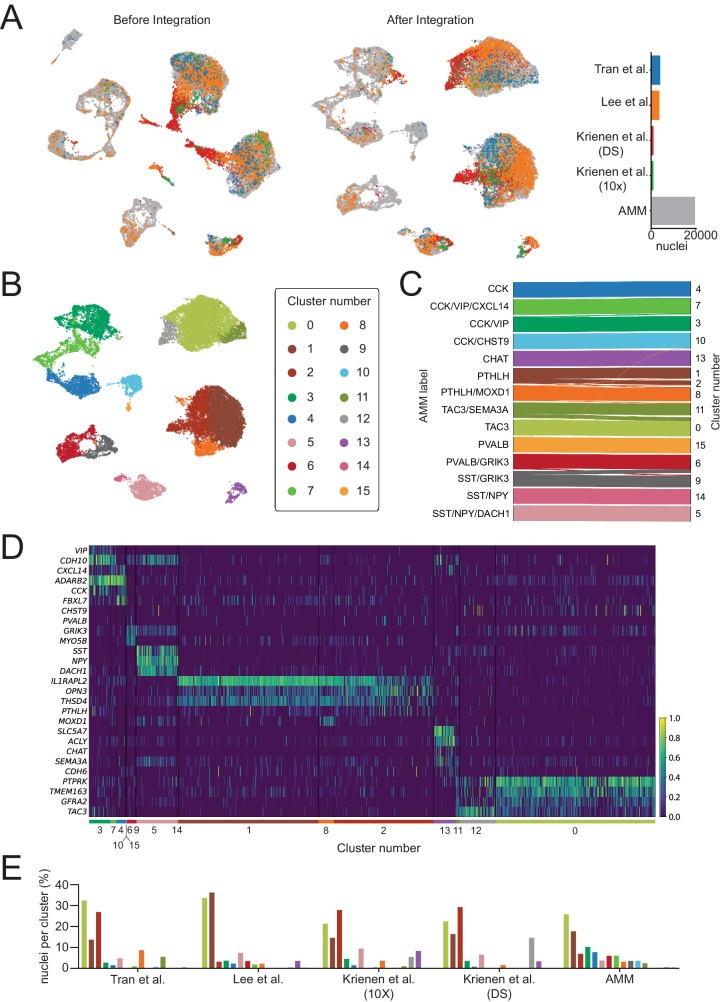
Fig. 6. Interneuron taxonomy is consistent across multiple human striatal snRNA-seq datasets.
A (left) UMAP of interneuron nuclei from five different datasets before and (middle) after integration with scVI. (right) Barplot indicating the total number of nuclei from each dataset. B UMAP of the integrated data colored by cluster. C Shankey diagram relating the labels of the nuclei in the AMM dataset to the clusters obtained on the integrated data. Only assignments with more than 1% of the cells of each subclass are shown. D Normalized expression of interneuron subclass marker genes on the integrated public datasets (excluding our own). E On each dataset (x-axis), each bar represents the percentage of all interneuron nuclei detected in that dataset (y-axis) that belong to a specific cluster color-coded as in (C).

