
Figure 4.
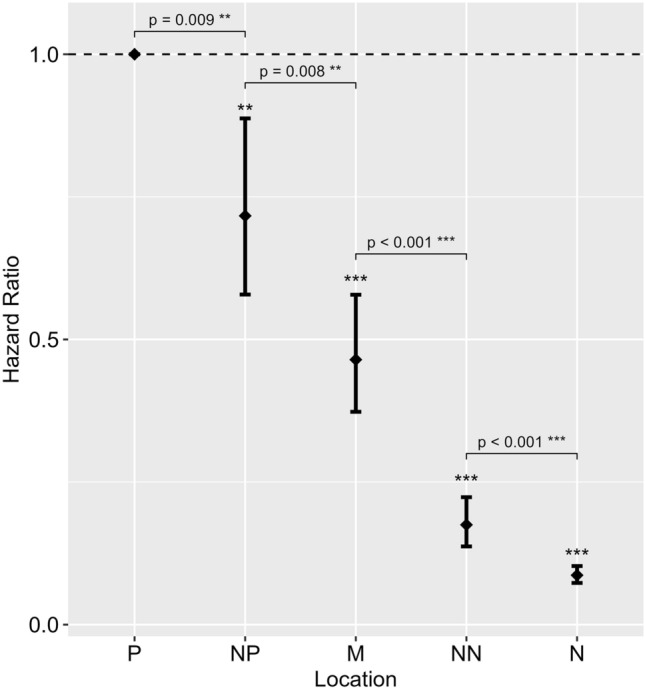
Plot showing the results of the Cox mixed-effects analysis for the effect of location on the likelihood of approaching the bowl. The horizontal dashed line indicates the reference level (Hazard Ratio 1): positive location (P), to which the likelihood of approaching the bowl when placed at the near-positive (NP), middle (M), near-negative (NN), and negative (N) locations were compared. Results show a decrease in likelihood of approaching the bowl at each location (Hazard Ratio < 1) compared to the P location. Significance levels are indicated by the asterisks above each bar. Error bars represent 95% confidence intervals. Pairwise differences between locations are indicated by the square brackets. Significance codes: ***p < 0.001, **p < 0.01, *p < 0.05.