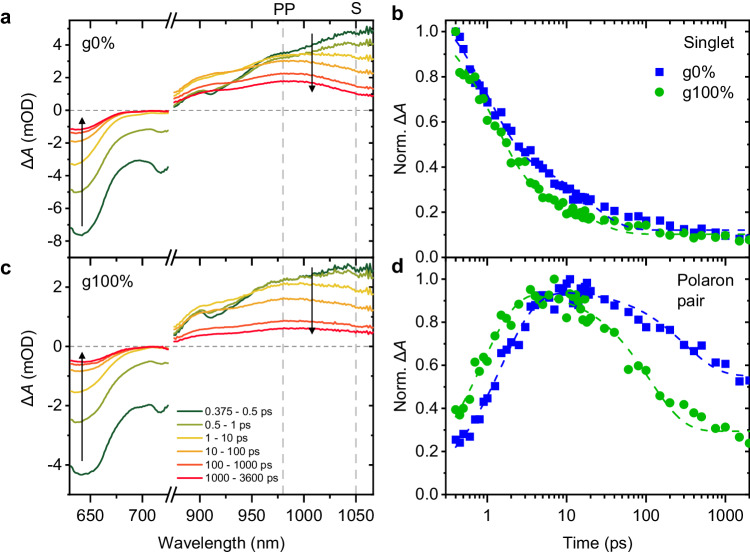
Fig. 4. Raw TA spectra of the g0% and g100% polymers.
Shown are raw TA spectra for thin-film samples of the (a) g0% and (c) g100% polymers at different pump-probe delay times, probed from 630 nm–1060 nm after photoexcitation at 600 nm, 17 μJ cm-2. Spectra are averaged over the delay times indicated. The negative band corresponds to ground-state bleach (640 nm) and stimulated emission from the excited state (720 nm). The broad, positive band in the NIR region is attributed to the photoinduced absorption of the photoexcited state. The shorter-lived signal centred at ≈1050 nm is attributed to singlet excitons (labelled ‘S’) and the longer-lived signal centred at ≈980 nm to polaron pairs (labelled ‘PP’). Vertical arrows show the direction of evolution of the spectra over time. b Normalised kinetics of the deconvoluted singlet TA spectrum, fitted with a biexponential decay (dashed lines). d Normalised kinetics of the deconvoluted PP TA spectrum, fitted with a multi-exponential (dashed lines). Source data are provided as a Source Data file.

