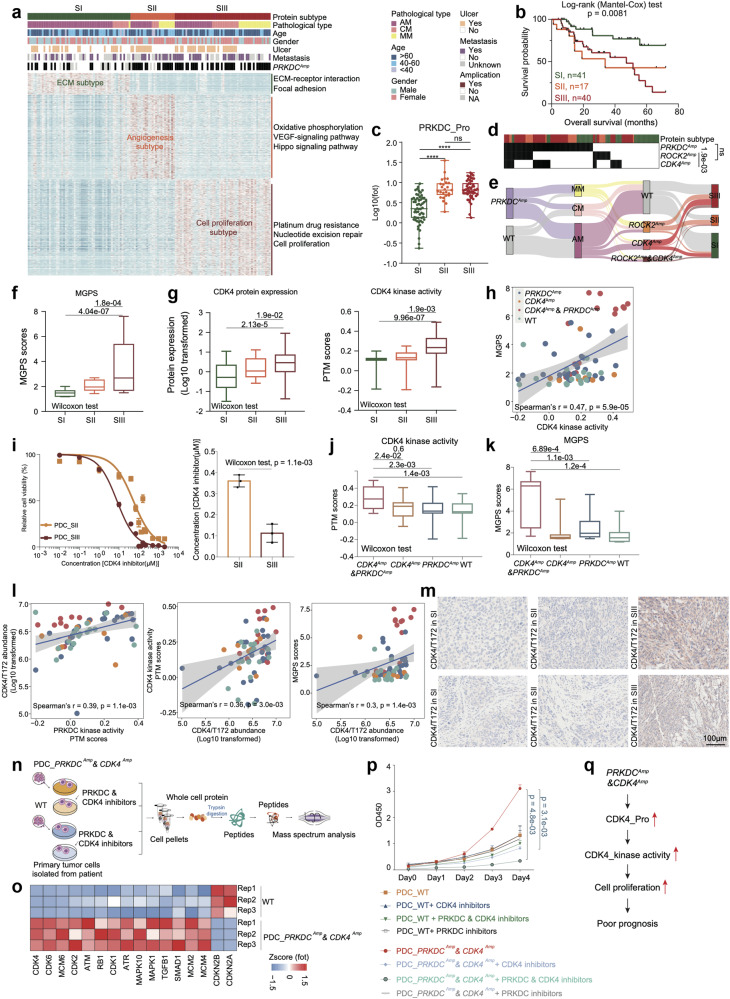
Fig. 4. Proteomic subtypes of primary melanomas.
a Heatmap illustrated clinical information, and frequency of PRKDC amplicons in 137 melanoma patients. The remaining section illustrates global proteomic features upregulated in the three proteomic subtypes. The pathways enriched by proteins elevated in corresponding subgroups are labeled on the right. b The association of three proteomic subtypes with clinical outcomes in melanoma patients (SI: n = 41; SII: n = 17; SIII: n = 40) (p value based on the log-rank test). c The boxplot showed the protein expression of PRKDC in the three proteomic subtypes (n = 137) (Wilcoxon rank test, ****p < 0.0001). d Heatmap illustrated the amplification frequency of PRKDC, CDK4, ROCK2 in the three proteomic subtypes (Fisher’s exact test). e Sankey plot showed the amplification frequency of PRKDC, CDK4, and ROCK2 in the three pathological subtypes and three proteomic subtypes of melanomas. f The boxplot showed the MGPS score in the three proteomic subtypes (n = 137) (Wilcoxon rank test). g The boxplot showed the protein expression and kinase activity of CDK4 in the three proteomic subtypes (n = 137) (Wilcoxon rank test). h Spearman-rank correlation of the CDK4’s kinase activity and MGPS score in melanomas (n = 96). i Dose–response curves of CDK4 inhibitor were determined on day 2 after inhibitors adding in PDCs from melanoma patients of SII and SIII proteomic subtypes. The data represent the mean values ± SD (n = 3) (left); IC50 values of CDK4 inhibitor were determined on day 2 after inhibitors adding. The data represent the mean values ± SD (n = 3) (right). j The boxplot showed the PTM score of CDK4 in patients harboring CDK4 amplicons & PRKDC amplicons, or only PRKDC amplicons, or only CDK4 amplicons and WT samples in our cohort (n = 96) (Wilcoxon rank test). k The boxplot showed the MGPS score in patients harboring CDK4 amplicons & PRKDC amplicons, or only PRKDC amplicons, or only CDK4 amplicons and WT samples in our cohort (n = 124) (Wilcoxon rank test). l Spearman-rank correlation of the PRKDC’s kinase activity and CDK4/T172’s abundance in melanomas (left); Spearman-rank correlation of the CDK4/T172’s abundance and CDK4’s kinase activity in melanomas (middle); Spearman-rank correlation of the CDK4/T172’s abundance and MGPS score in melanomas (right). m Immunohistochemistry of CDK4/T172 in SII and SIII proteomic subtype samples, scale bar = 100 μm. n The workflow showed the sample collection for mass spectrum analysis. o Heatmap illustrated the protein expression of CDK4, CDK6, et al. participating in cell cycle were upregulated in the PDCs from melanoma patients harboring CDK4 amplicons & PRKDC amplicons. p Proliferation of the PDCs from melanoma patients with or without PRKDC amplification and CDK4 amplification based on the use of PRKDC inhibitor and CDK4 inhibitor, or only CDK4 inhibitor, or only PRKDC inhibitor, or control (two-way ANOVA followed by Tukey’s multiple comparison test). The data are presented as mean ± SEM. q Illustration of the activation of PRKDC–CDK4 signaling pathway combined with cell proliferation led to poor prognosis in melanomas.

