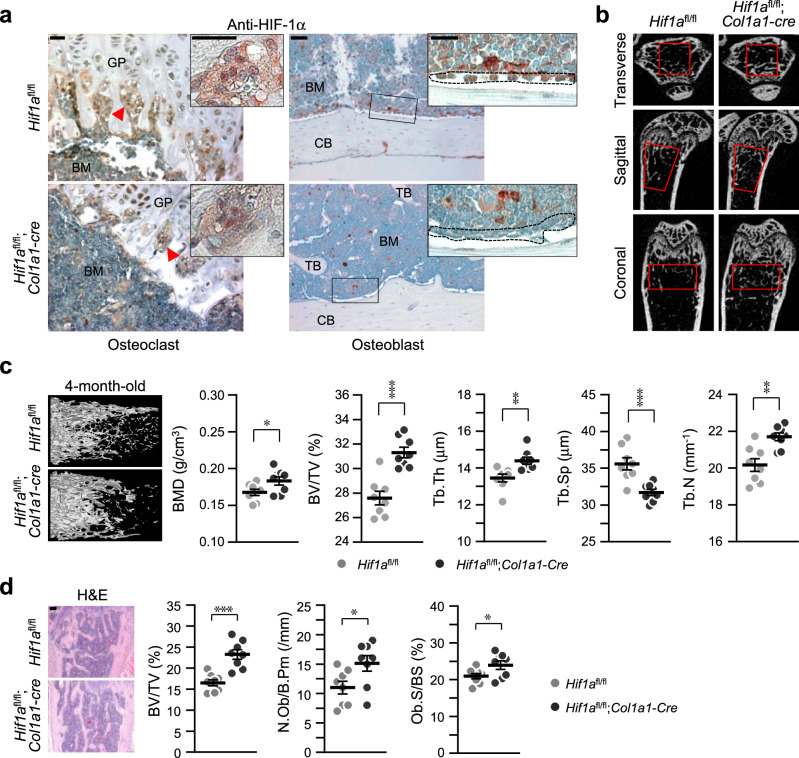
Fig. 3. Osteoblast-specific depletion of Hif1a increases bone mass.
a Osteoblast-specific, but not osteoclasts, depletion of Hif1a in Hif1afl/fl;Col1a1-Cre mice and their wild-type littermates, Hif1afl/fl was verified by immunohistochemistry with anti-HIF-1α antibody (n = 3). The arrows indicate osteoclasts, and the dotted line indicates osteoblasts. GP, growth plate; BM, bone marrow; TB, trabecula bone; CB, cortical bone. Scale bar, 25 μm. b μCT images of femurs captured by the transverse (top), sagittal (middle), and coronal (bottom) planes. Red boxes indicate regions of interest. c Representative images of μCT reconstructions of trabecular bones and quantitative analyses of BMD, BV/TV, Tb.Th, Tb.Sp, and Tb.N of femora (n = 8). d H&E staining results and bone histomorphometric analysis, including BV/TV, N.Ob/B.Pm, and Ob.S/BS (n = 8). Scale bar, 100 μm. Values are presented as the mean ± SEM. Unpaired t-test was performed. *P < 0.05, **P < 0.01, and ***P < 0.001.

