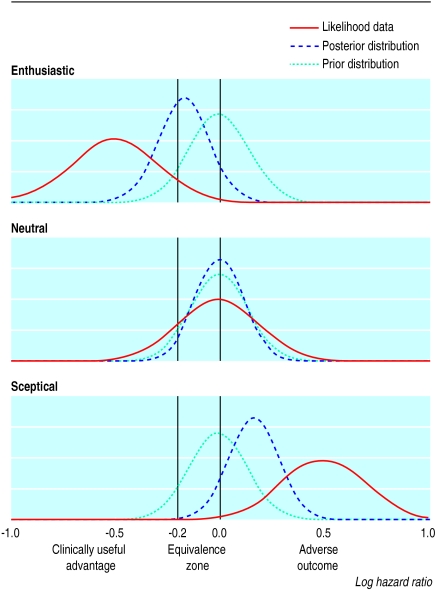
Figure 1.
Prior and posterior distributions and likelihood “data” for enthusiastic, neutral, and sceptical scenarios. The peak of each distribution corresponds to the most likely value of the true log hazard ratio, as estimated from the prior studies or the “data” or both (see text). The prior distribution in this example assumes that the two treatments are identical (log hazard ratio=0)

