
FIGURE 5.
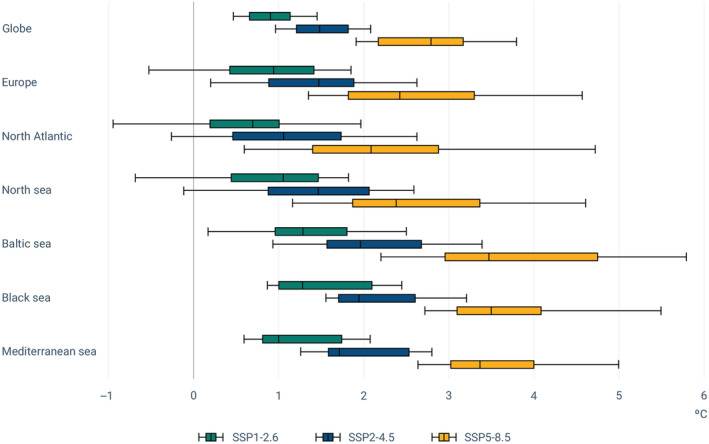
Projected sea surface temperature anomalies by 2100 under three different SSP scenarios (i.e. SSP1–2.6, SSP2–4.5 and SSP5–8.5) for European seas and global ocean as compared to 1991–2010. The boxplot shows the 5th, 25th, 50th, 75th and 95th percentiles (from https://www.eea.europa.eu/en/analysis/indicators/european‐sea‐surface‐temperature).