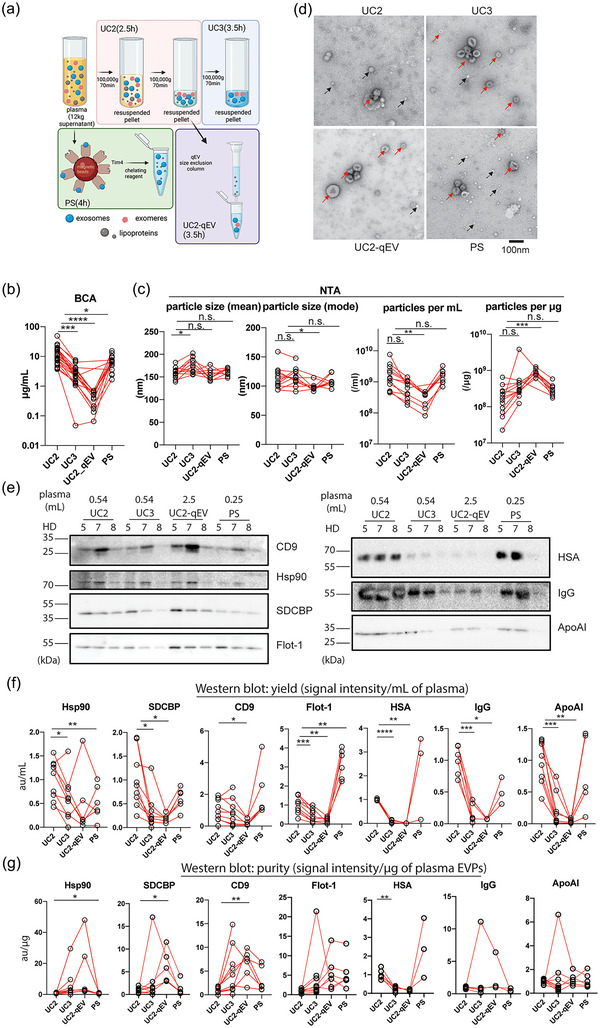
FIGURE 1.

Establishment and performance comparison of protocols for isolating plasma EVPs with improved purity. (a). Diagrams illustrating the four major procedures compared for performance for isolating plasma EVPs. Estimated execution time for each procedure is listed in parenthesis. Other methods examined but not illustrated in this figure include qEV‐DGC (size exclusion chromatography followed by density gradient ultracentrifugation), DGC+BE‐SEC (DGC followed by bind‐elute size exclusion chromatography),exoEasy Maxi Kit (Qiagen), Exo‐spin midi (Cell Guidance Systems), ExoQuick Exosome Isolation and RNA Purification Kit (for Serum & Plasma) (System Biosciences), and miRCURY Exosome Serum/Plasma Kit (Qiagen). (b). Quantification of total protein yield in isolated plasma EVPs using BCA assay. n > = 12. (c) Assessment of particle size (mode and mean) and number (per mL of plasma input and per µg of isolated EVPs) in isolated plasma EVPs using Nanoparticle Tracking Analysis (NTA). n > = 8. (d) Representative TEM images of plasma EVPs isolated using different approaches. Red and black arrows indicate EVPs and particles resembling lipoprotein nanoparticles. Scale bar, 100 nm. (e) Western blotting (WB) analysis of EVP marker proteins and potential contaminants in plasma EVPs isolated from three healthy donors (HD). The volume of input plasma analyzed for each sample is indicated on top of the images. CD9, Tetraspanin CD9; Hsp90, Heat shock protein 90; SDCBP, Syntenin‐1; Flot‐1, Flotillin‐1; HSA, Human serum albumin; IgG, Immunoglobulin G; and ApoAI, Apolipoprotein AI. f and g. Quantification of WB analysis results to evaluate the yield (expressed as EVP marker protein signal/mL of plasma) and purity (expressed as EVP marker protein or contaminant signal/µg of EVPs) of isolated plasma EVPs, respectively. n > = 3. In all graphs, the bar indicates mean. One‐way ANOVA with Geisser‐Greenhouse correction was used, followed with Bonferroni's multiple comparisons test to determine the statistical significance.
