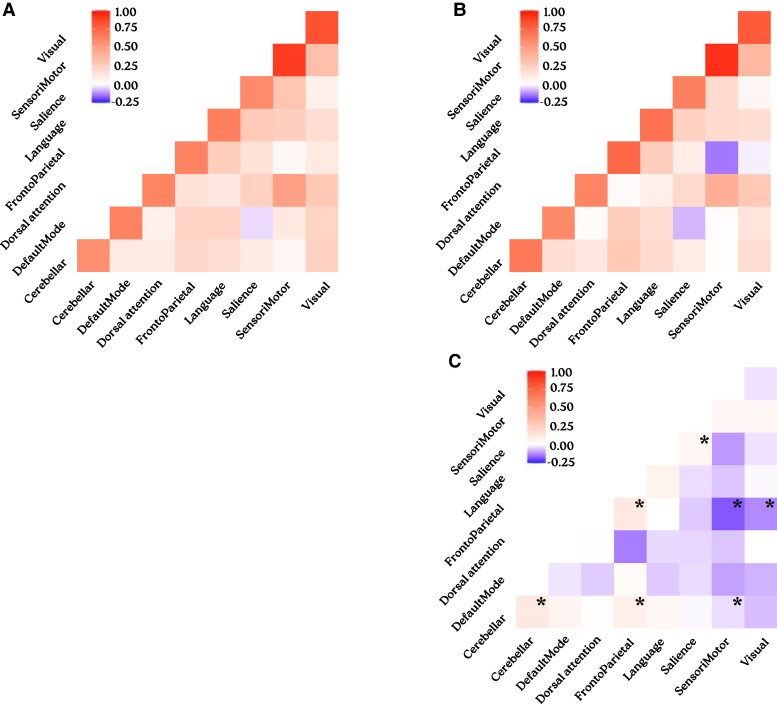
Figure 3.
Resting connectivity in OHCA survivors compared to healthy controls. Heatmap illustrating Fisher’s z-transformed correlation coefficients within and between resting-state networks in OHCA survivors (n = 37, A) and healthy controls (n = 124, B). A comparative heatmap shows the differences in network connectivity between OHCA survivors and healthy controls (C). The use of propensity score weighting for demographic variables demonstrated significant decreases in within-network connectivity and increases in between-network connectivity, especially involving the frontoparietal network. This pattern suggests a potential compensatory response to maintain cognitive function in the OHCA survivor group. Asterisks (*) denotes significantly altered connectivities after adjustment for multiple testing (P < 0.015).

