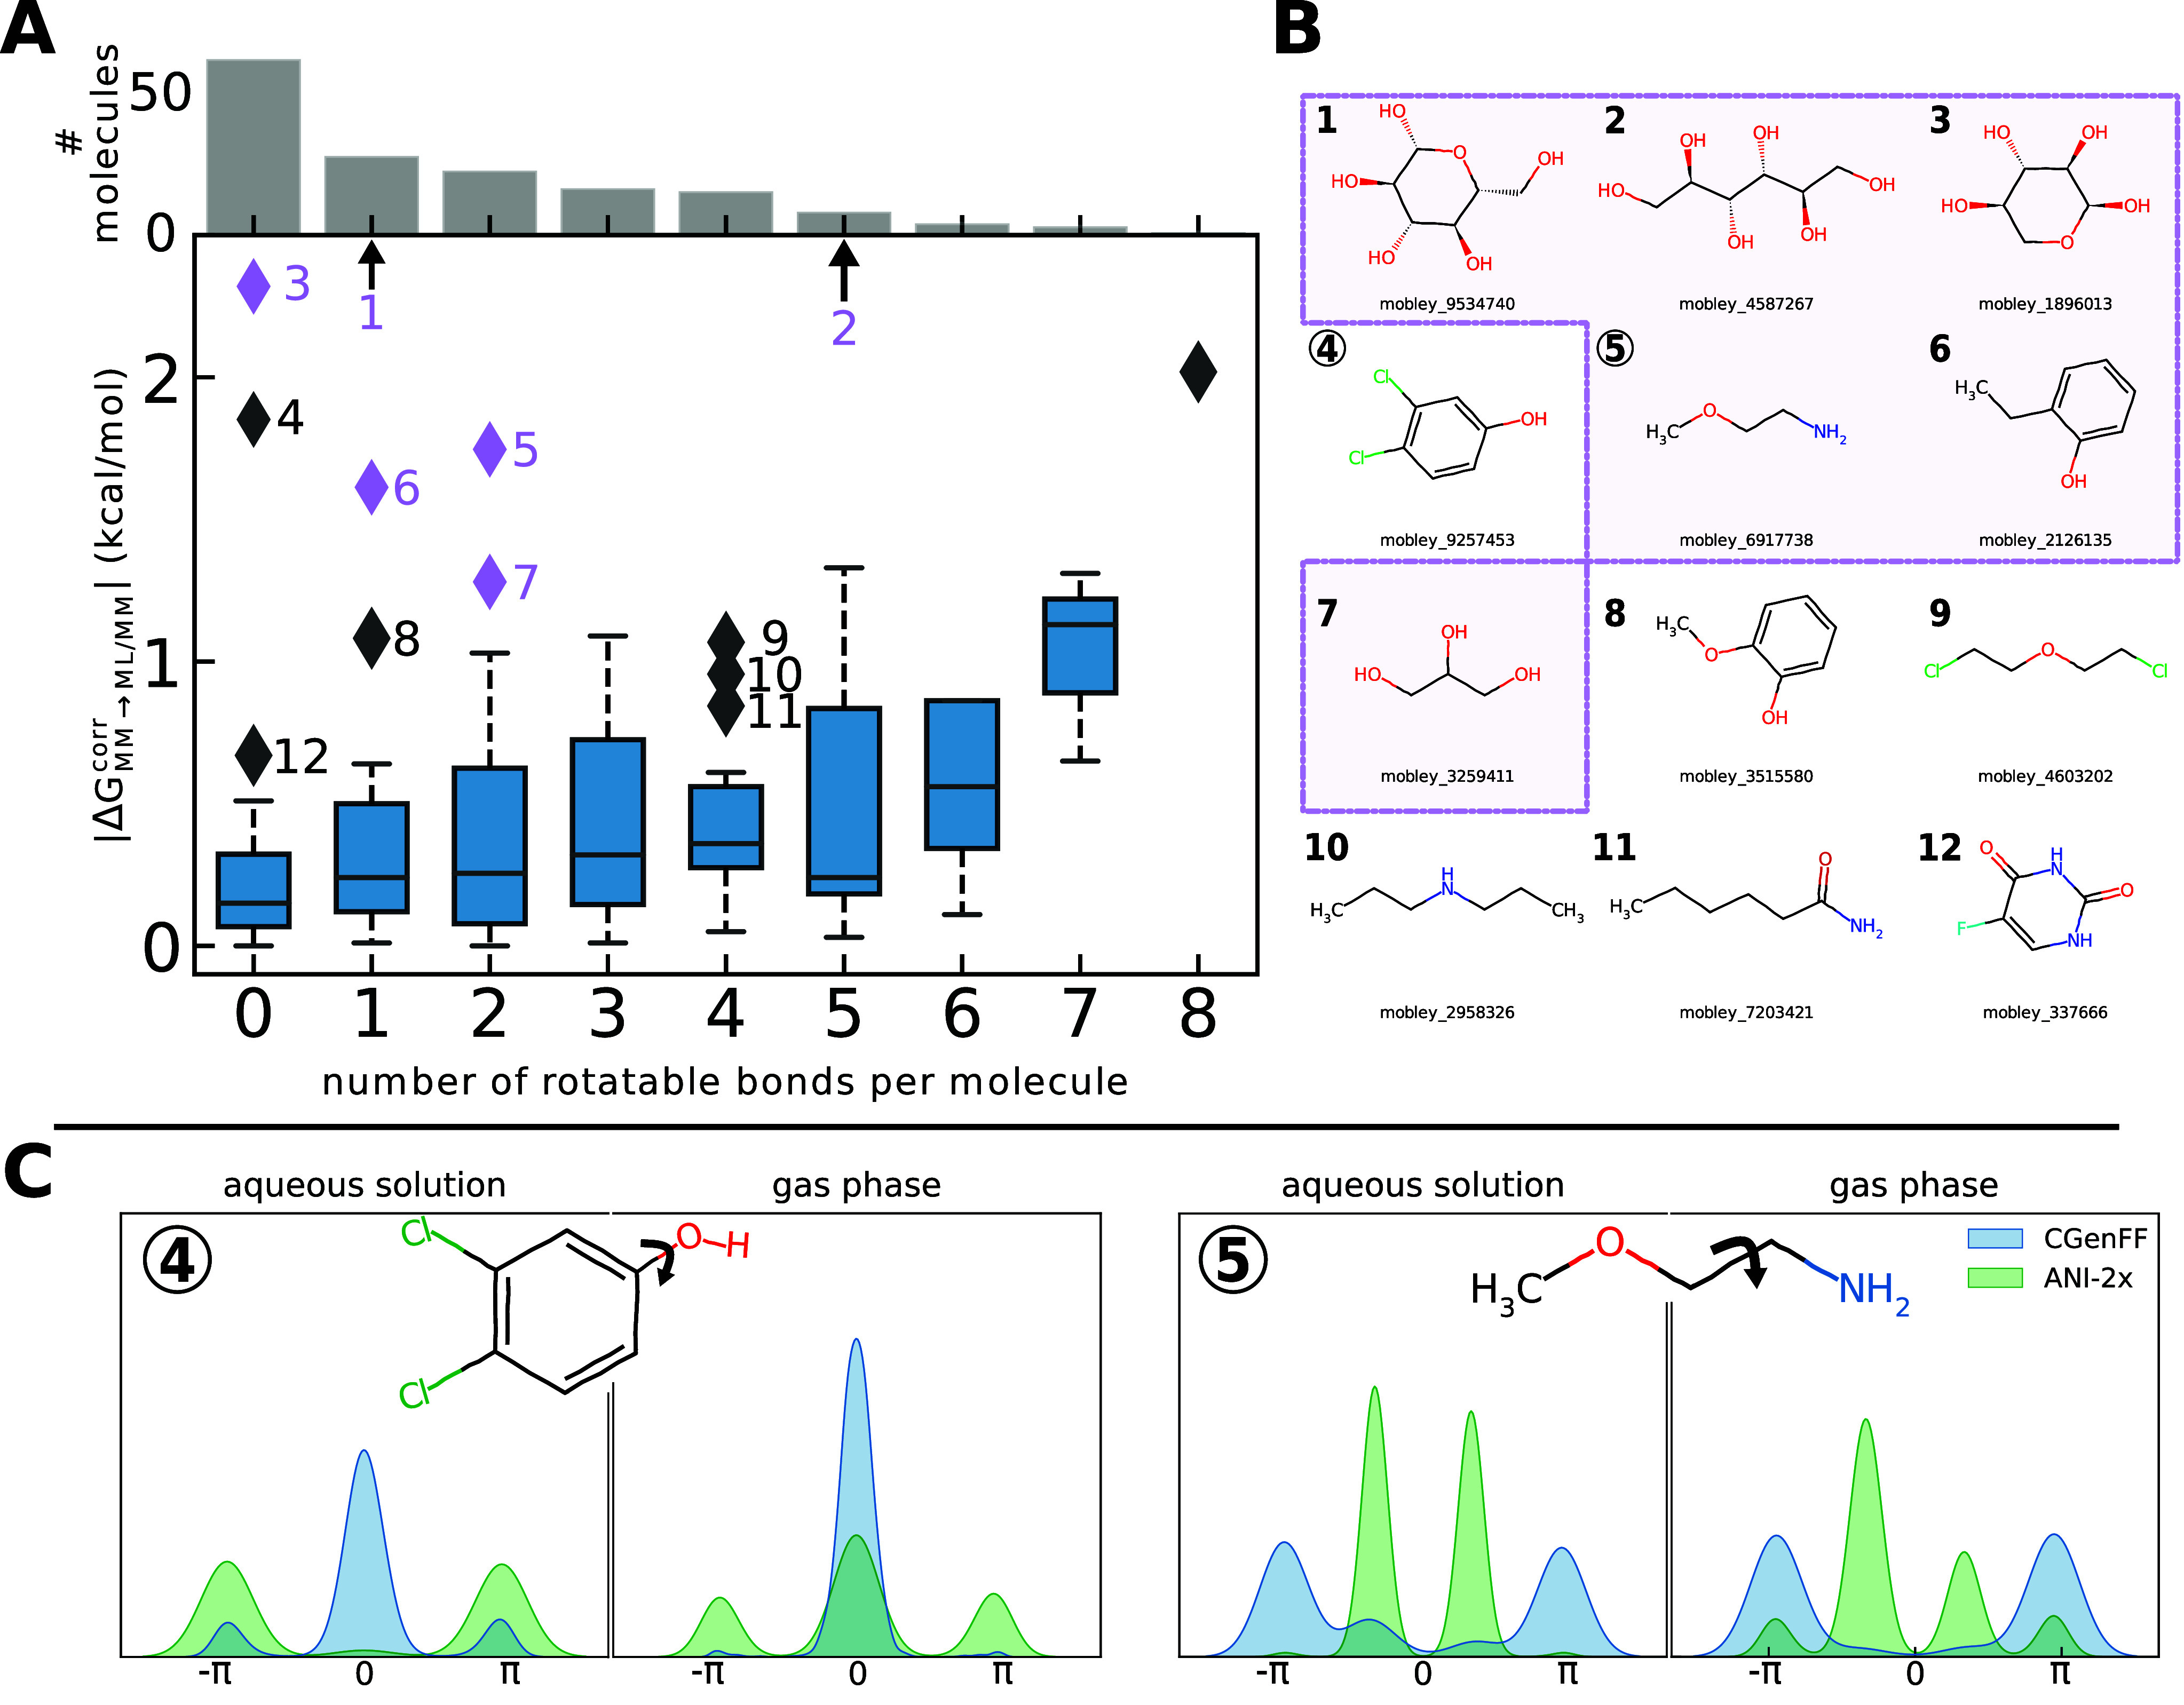
Figure 5.

Panel A: Box plot of the unidirectional NNP correction (ΔGcorrMM→NNP/MM) as a function of the number of rotatable bonds for the 156 compound subset using protocol UVIE (an analogous plot for EXS is shown in Figure S2 in the Supporting Information). Molecules that are outliers in terms of ΔGcorrMM→NNP/MM are indicated as diamonds and labeled by numbers, starting with 1 for the compound having the highest correction value. Compounds that are also outliers when using protocol EXS are colored in purple. The bars at the top of the plot indicate how many molecules have this number of rotatable bonds. Panel B: Molecular structures of the outliers 1–12. Molecules in the purple box are also outliers when using protocol EXS. Panel C: Density of the indicated dihedral angle of compounds 4 (left side) and 5 (right side), respectively, in the gas phase and in aqueous solution when using CGenFF (blue) and ANI-2x (green).
