
Figure 1: Global PM2·5 and diabetes data for 2019.
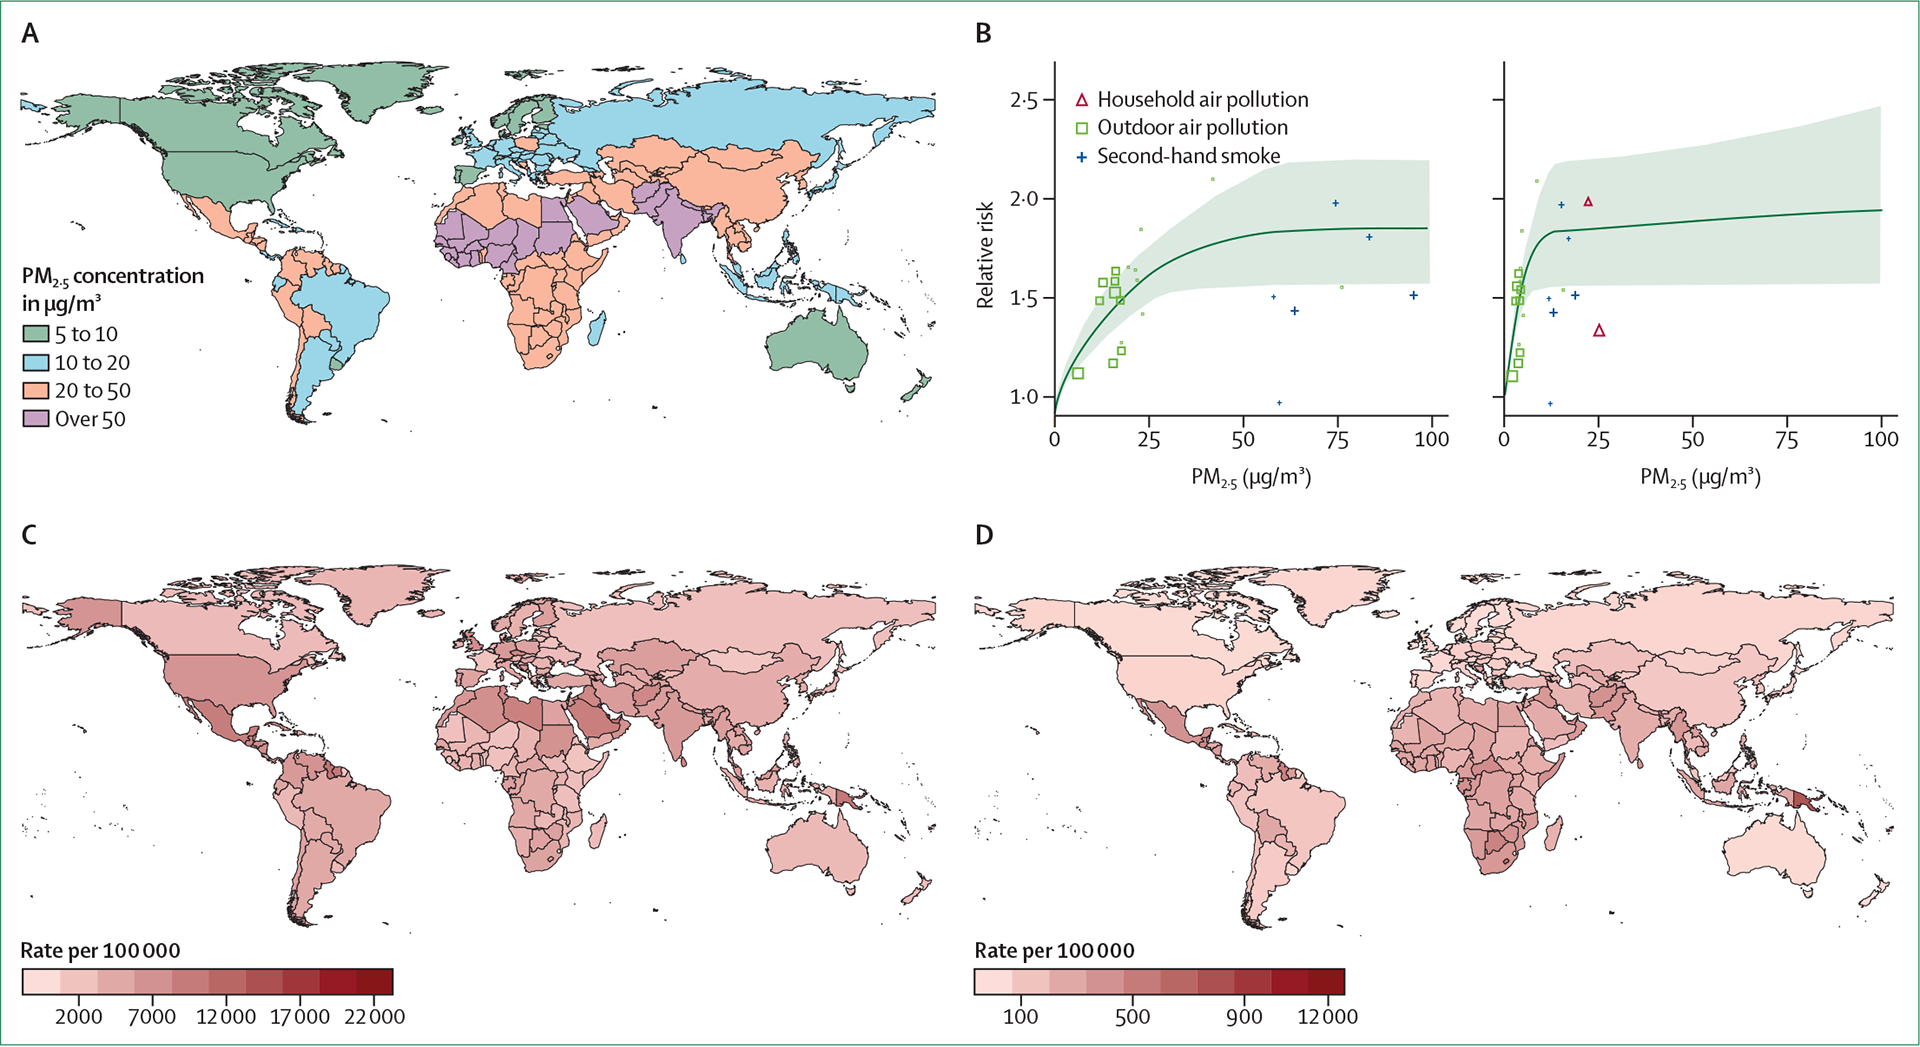
From Global Burden of Disease data.7 (A) Ambient PM2·5 concentrations. (B) Exposure–response curve of PM2.5 and diabetes, shown across PM2·5 0–100 μg/m3 and 0–500 μg/m3. (C) Age-standardised prevalence of type 2 diabetes. (D) Type 2 diabetes age-standardised disability-adjusted life years associated with particulate matter pollution. PM2·5=particulate matter smaller than 2·5 μm.