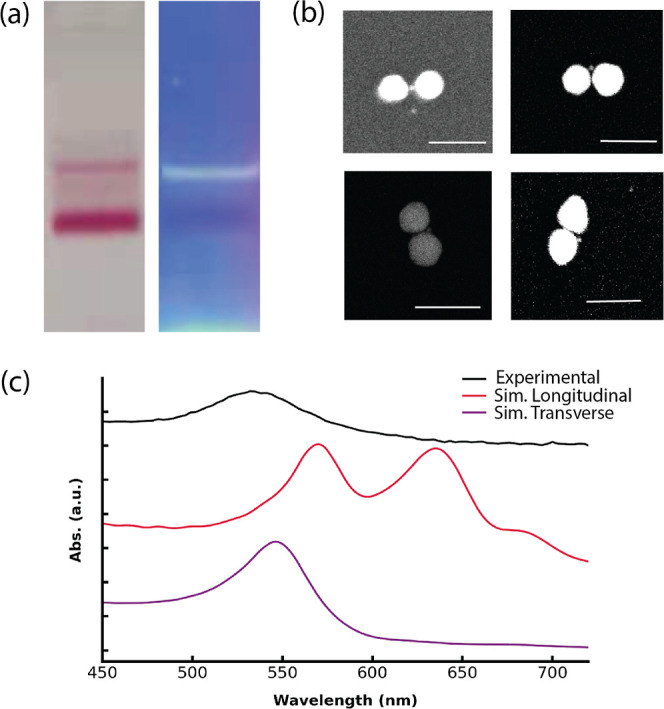
Figure 7.

(a) Agarose gel characterization of 50–10–50 nm trimers. Left: Mixture of 50 nm fAuNPs and the cage-encapsulated 10 nm fAuNPs, the fast-migrating band is unreacted 50 nm fAuNP and the slow-moving band the assembled heterotrimer. Right: Same as left but under UV excitation, the fluorescence signal (yellow-green band) of cage on the right lined up with the slow-moving pink band on the left. (b) SEM images of 50-10-50 nm trimers. Backscattering detector was used. Scale bar: 100 nm. (c) Top: UV–vis absorbance spectra of experimental and simulated heterotrimer. (d) Bottom: FDTD simulations showing the distributions of the local electric field enhancement (E/E0) of trimers at 633 nm. Trimer with a bending angle θ = 0°, average SERS EF about 2 nm away from the central particle is ∼109. Scale bars: 10 nm.
