Figure 3.
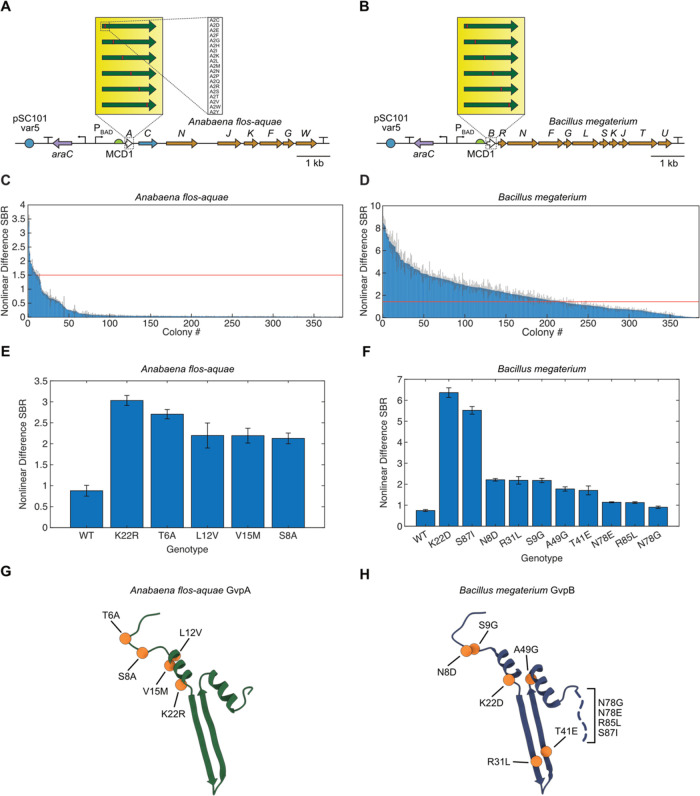
First round of directed evolution of A. flos-aquae and B. megaterium structural proteins. (A, B) Diagrams of the mutagenized A. flos-aquae and B. megaterium gene clusters, depicting the scanning site saturation libraries screened in the first round of evolution. (C, D) Nonlinear US difference signal-to-background ratio (SBR) from all screened mutants of both clusters. Red lines indicate the nonlinear difference SBR of the WT for that cluster. Error bars represent standard error. N = 3 technical replicates of one biological sample. (E, F) Nonlinear US difference SBR for the WT and top mutants for each cluster. Error bars represent standard error. N = 4 biological samples (each an average of 3 technical replicates). (G, H) Locations of top mutations from (E, F) in the GvpA/GvpB structure (PDB 8GBS and 7R1C).

