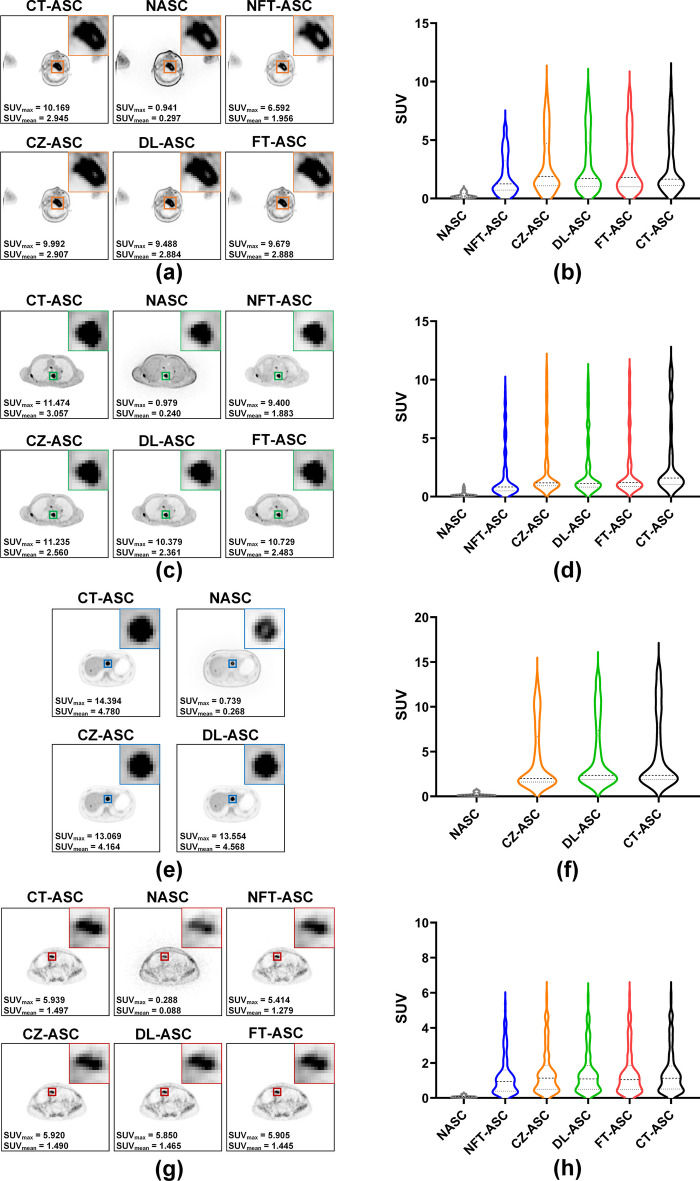
Fig. 8.
Sample tumor results of CT-ASC, NASC, NFT-ASC, CZ-ASC, DL-ASC and FT-ASC methods in a, b head-neck region of a male patient (Age: 65, BMI: 23.11, nasopharyngeal carcinoma) in [18F]FAPI dataset, c, d chest region of a female patient (Age: 65, BMI: 23.11, bone tumor) in [18F]FAPI dataset, e, f abdomen region of a male patient (Age: 29, BMI: 22.21, liver tumor) in [18F]FDG dataset, and g, h pelvis region of a female patient (Age: 52, BMI: 21.72, ovarian cancer) in [68Ga]FAPI dataset. The enlarged ROIs are displayed in the top right corner of the corresponding image. The SUVmax and SUVmean values are shown in the bottom left corner of the corresponding image. The SUV results of ROIs for different methods are presented using violin plots

