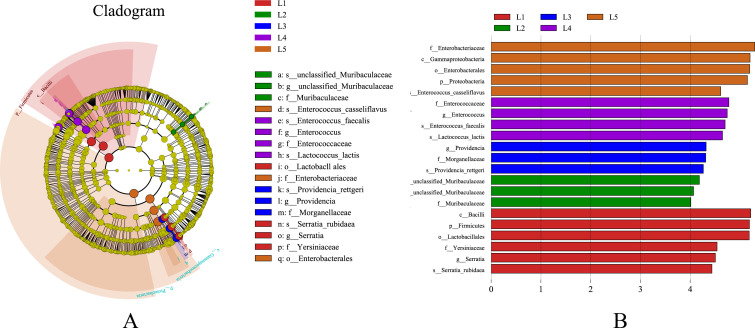
Fig 5.
Linear discriminant analysis effect size (LEfSe) analysis diagram. (A) Circles radiating from the inside to the outside of the evolutionary branching diagram represent the taxonomic levels from phylum to species; each small circle at a different taxonomic level represents a taxon on at that level, and the diameter of the small circles is proportional to the relative abundance; yellow indicates no significant differences; other differences are colored according to the group with the highest abundance of the species. Different colors indicate different subgroups, and different colored nodes indicate the microbiota that play an important role in the subgroup. (B) The vertical axis shows the taxonomic units with significant differences between groups; the horizontal axis shows a bar graph visualizing the logarithmic score of LDA for each taxonomic unit. Taxa are sorted according to their scores, with longer lengths indicating more significant differences between taxa. The color of the bars indicates the sample group with high abundance for that taxon.

