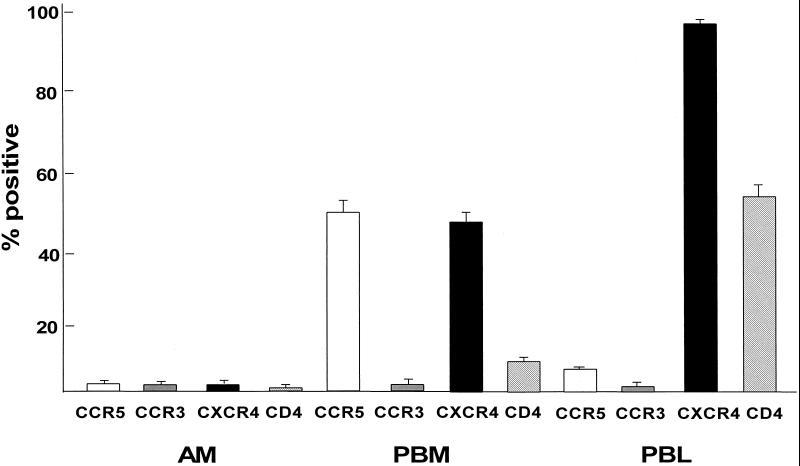
FIG. 3.
Quantitative analysis of chemokine receptor surface expression on AM compared to that on autologous blood monocytes and blood lymphocytes. AM, PBM, and PBL from healthy individuals were labeled with antibodies against CCR5, CCR3, CXCR4, and CD4 and evaluated by flow cytometry (as described in the legend for Fig. 2). Shown are the means ± standard errors of the means for six individuals.

