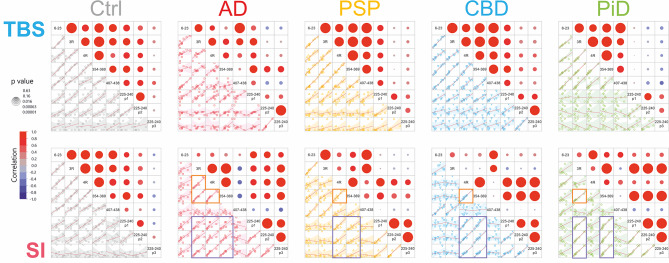
Fig. 6.
Selected correlations from IP with 77G7 for both the TBS and SI fractions. Correlations are Pearson’s r. Indicated with orange boxes are the high correlation with the respective disease-associated major isoform with a non-specific MTBR peptide for the SI fraction. Purple boxes indicate the high positive correlation with MTBR peptides and phosphorylated peptides in the proline-rich mid-region in the SI fraction. In AD, all MTBR peptides correlate with each other and with the phosphorylated peptides. In PSP and CBD the only the 4R specific and the non-specific peptides correlate, while in PiD the situation is the opposite with only the 3R specific and the non-specific peptides correlating. Correlation coefficient values are indicated by the colour scale and significance by size of the circles

