Fig. 2.
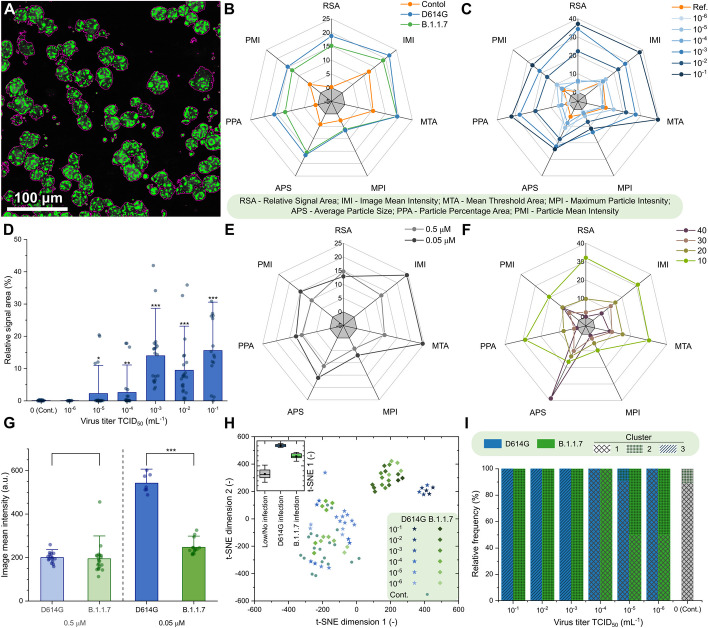
Automatic analysis of the 2P microscopy images of infected cells using SARS-CoV-2 variants D614G and B.1.1.7. A Purple contours indicate the areas automatically defined as particles during this analysis. B, C, E, F Spider charts showing the effects of B variant, C virus titer, E dye concentration, and F photomultiplier tube (PMT) relative voltage on the range-normalized values of seven different image parameters obtained from 2P microscopy images. The error bars for the spider charts can be found in Supplementary Fig. 7. D The image parameter called “relative signal area” shows a significant increase at virus titers higher than TCID50 10–3 mL−1. G The image parameter called “image mean intensity” for the two studied variants at high virus titer (TCID50 > 10–3 mL−1) at 0.05 μM and 0.5 μM dye concentration. H t-Distributed stochastic neighbor embedding (t-SNE) 2D plot obtained from all the seven image parameters recorded at 0.5 µM dye concentration shows three clusters depending on the virus variant and titer. Inset shows that the three groups, namely no or low infection, infection with D614G variant, and infection with B.1.1.7 variant are clearly separated along the first dimension. I Classification of the images corresponding to different variants at various virus titer in three clusters by seven-dimensional Gaussian mixture model clustering (error bars show standard deviation; significance levels as *p ≤ 0.1; **p ≤ 0.05; ***p ≤ 0.01.)

