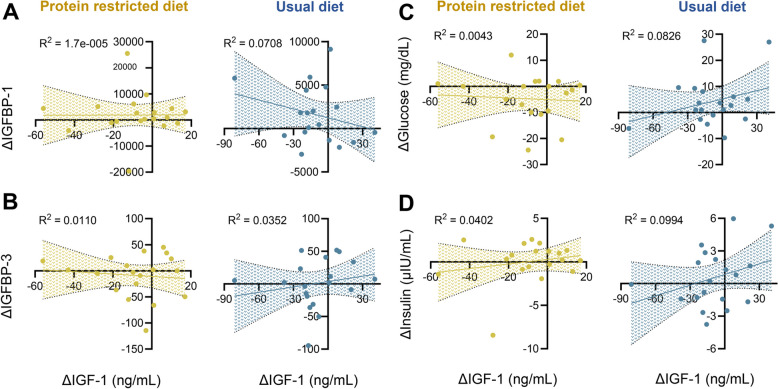
Fig. 2.
Individual variations in IGF-1 levels are not explained by changes in glucose, insulin, or IGF-binding proteins. A-D Linear regression analysis between changes in IGF-1 (Δ IGF-1) and Δ IGFBP-1, Δ IGFBP-3, Δ glucose, and Δ insulin for the intervention (yellow) and control (blue) arms. Delta (Δ) represents the value at follow up minus the value at baseline. Each dot represents an individual (n = 19 per group). The shaded areas show the 95% confidence bands for the best-fit line. R2 values quantify the strength of the correlation, with R2 < 0.2 suggesting a lack of association

