Fig. 5.
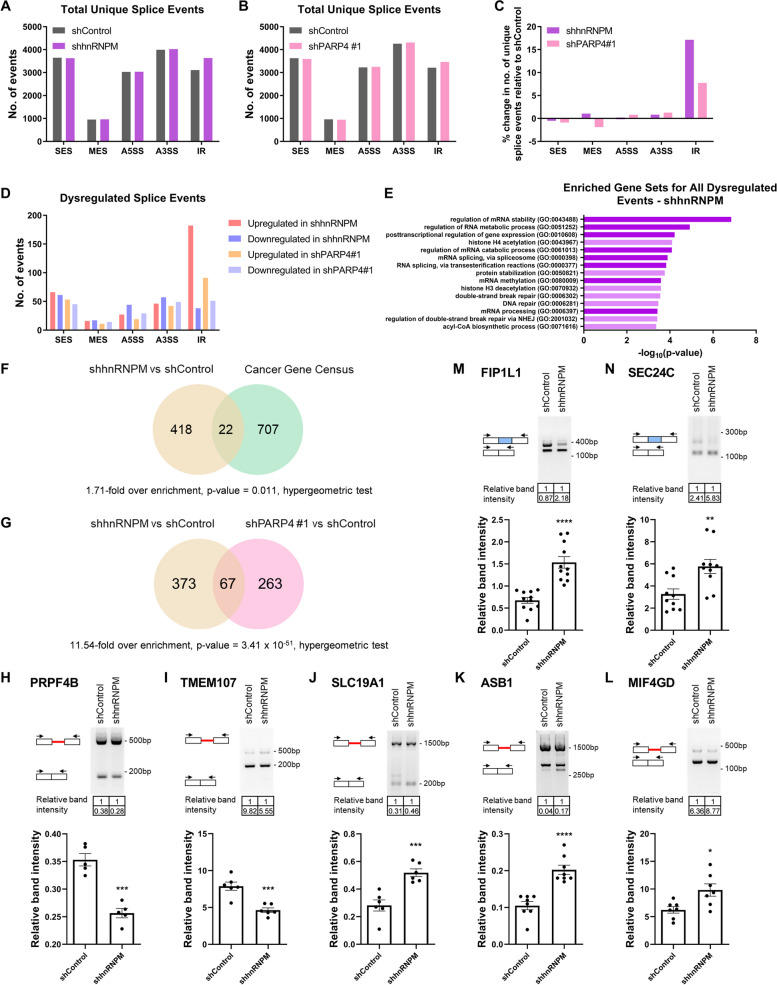
hnRNPM and PARP4 regulate splicing in the LUAD context. A, B Number of unique splice events with ≥ 5 supporting sequencing reads detected across the five event categories in A) iSAEC-K shControl and shhnRNPM cells and B) iSAEC-K shControl and shPARP4#1 cells. C Percentage change in number of unique splice events detected across the five event categories in iSAEC-K shhnRNPM (purple) or shPARP4#1 (pink) relative to shControl cells. D Number of significantly upregulated or downregulated splice events (|ΔPSI|> 10, p value < 0.05) upon hnRNPM or PARP4 loss across the five event categories. E Top 15 enriched GO Biological Process 2021 gene sets among genes with significantly dysregulated splicing upon hnRNPM knockdown (|ΔPSI|> 10, p value < 0.05). Gene sets related to RNA metabolism and splicing are highlighted with a darker shade. F Overlap between genes with splicing regulated by hnRNPM and cancer-related genes defined by COSMIC [58], with 1.71-fold over enrichment and p value = 0.011, as determined by hypergeometric test. G Overlap between genes with splicing regulated by hnRNPM and genes with splicing regulated by PARP4, with 11.54-fold over enrichment and p value = 3.41 × 10–51, as determined by hypergeometric test. H-N Representative gel electrophoresis images of targeted PCR validation of upregulated (H, I) and downregulated (J, K, L) IR events, as well as (M, N) upregulated SES events in iSAEC-K shControl and shhnRNPM samples. Band intensity was quantified, with that of the lower band normalized to that of the upper band, and indicated below the respective lanes. To the left of the respective bands, a schematic diagram indicates the splicing outcome. The red line represents the retained intron, the blue bar represents the alternatively skipped exon, while black arrows represent the PCR primers. The bar graph at the bottom summarizes the results from experimental replicates. Data represent the mean ± s.e.m., n ≥ 5

