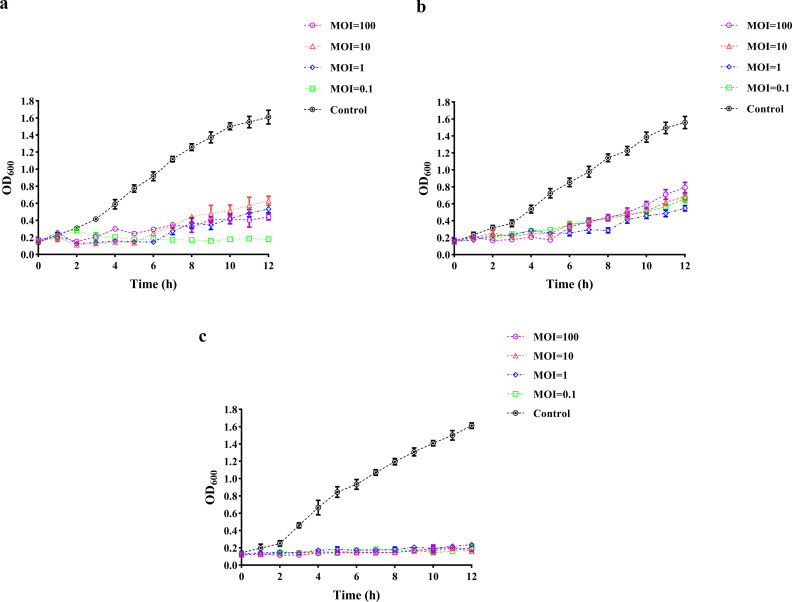
Fig 3.
Phage inhibition time at different MOIs. Inoculated with different MOIs, the OD600 values were measured every hour to observe the production of resistant bacteria. Equal amounts of PBS-inoculated bacteria were used as controls. (a) Inhibition curve of P1. (b) Inhibition curve of DP45. (c) Inhibition curve after combination of two phages. Error bars indicate the SD of three replicate counts.

