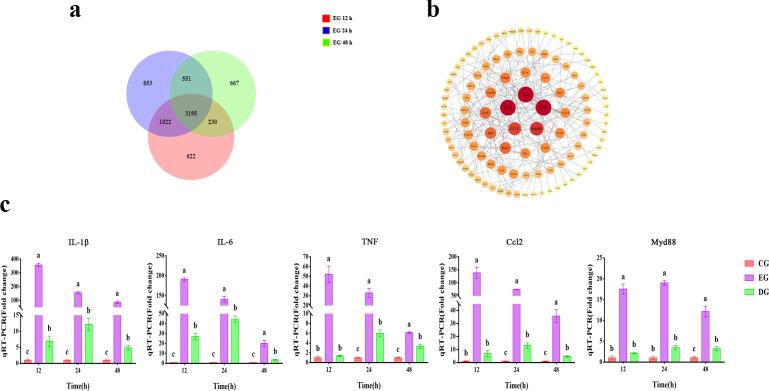
Fig 8.
Effect of phage treatment on the expression of hub immune-related DEGs. (a) Venn diagram of DEGs at different time points in the EG group. (b) PPI analysis of DEGs in the EG group. (c) Expression of hub immune-related genes in the CG, EG, and DG groups at different time points. Expressed as mean ± SD, with different letters representing significant differences.

