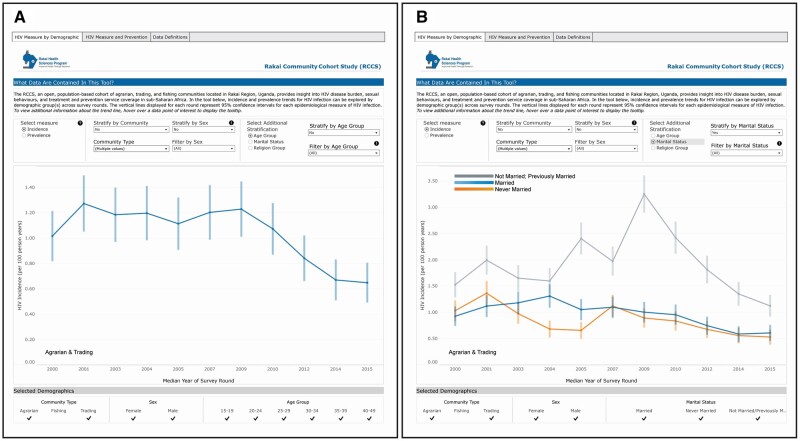
Figure 3.
Case study #1: HIV incidence trends in agrarian and trading communities stratified by marital status. Using the “HIV Measure by Demographic” tab of the dashboard, users can view overall HIV incidence among the agrarian and trading communities (grouped) by selecting the following filters and stratifications: Select measure = “Incidence,” Stratify by Community = “No,” Community Type = “Agrarian” and “Trading,” Stratify by Sex = “No,” and Filter by Sex = “All” (A). To further stratify by marital status, users can update the right-hand side filters as follows: Select Additional Stratification = “Marital Status,” Stratify by Marital Status = “Yes,” and Filter by Marital Status = “All” (B). Singular data points represent the mean value for the specified year of survey round; vertical bars represent 95% confidence intervals.

