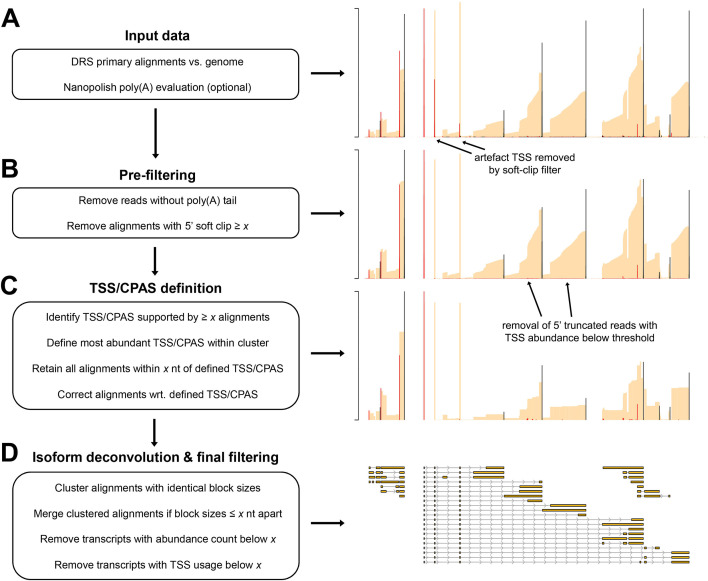
Fig 2.
Overview of the NAGATA methodology. (A) DRS genome alignments (beige) that are filtered to retain only primary mappings and (optionally) nanopolish poly(A) output files are used as input for NAGATA. Putative TSS (red) and CPAS (black) are defined (TSS/CPAS definition) by counting the number of alignments with identical 5′ (TSS) or 3′ (CPAS) ends. (B) Pre-filtering removes alignments with 5′ soft-clipping values greater than a specified value and optionally removes read alignments for which poly(A) tails are not detected by nanopolish. (C) TSS and CPAS are defined (TSS/CPAS definition) by counting the number of alignments with identical 5′ (TSS) or 3′ (CPAS) ends and considering only those exceeding a specified count as valid. For TSS/CPAS that pass this threshold, all neighboring TSS/CPAS within a defined distance are retained and their coordinates adjusted to the dominant TSS/CPAS position. At this stage, TU is defined and all alignments sharing the same CPAS are considered part of the same TU (i.e., transcripts with differing TSS but the same CPAS are considered part of the same TU). (D) For each resulting TU, transcript isoform deconvolution and final filtering are performed by first collapsing alignments if they share the same blockSize and blockStarts distribution and only those exceeding a specified count are considered valid. Alignments with similar blockSize/blockStart values (typically within 1–3 nt) are merged prior to filtering based on abundance counts. Finally, NAGATA applies a filter to remove transcripts with a TSS usage below a defined fraction.

