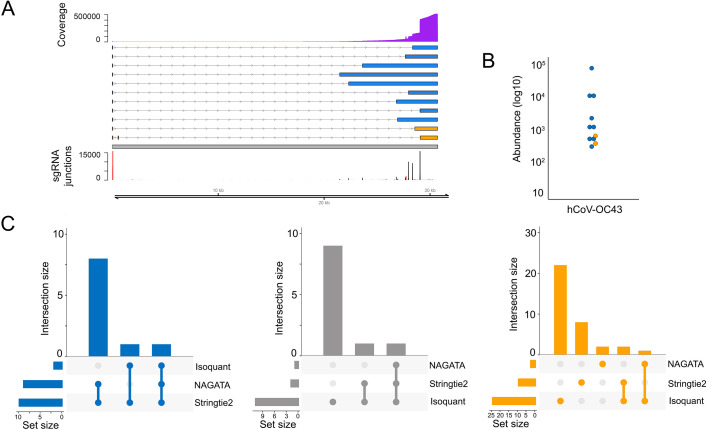
Fig 7.
Reconstructing the hCoV-OC43 transcriptome. (A) Schematic depicting the hCoV-OC43 transcriptome as constructed by NAGATA using a single previously published DRS data set (25). Read coverage is shown (purple) with the y-axis denoting read depth while the locations and abundances of sgRNA 5′ (red) and 3′ (black) junctions are also shown. Transcripts are colored according to classification (orange = not recorded in existing annotation, blue = recorded in existing annotation, gray = reported in existing annotation but not detected by NAGATA in this data set). Wide and thin boxes indicate canonical CDS domains and UTRs, respectively. (B) For each transcript, a raw abundance count was generated using NAGATA and color-coded according to transcript classification. (C) Upset plots denoting the number of transcripts reported by NAGATA, Stringtie2, and Isoquant, segregated according to (blue) overlaps with existing annotation, (gray) not detected, and (red) not present in original annotation.

