FIGURE 1.

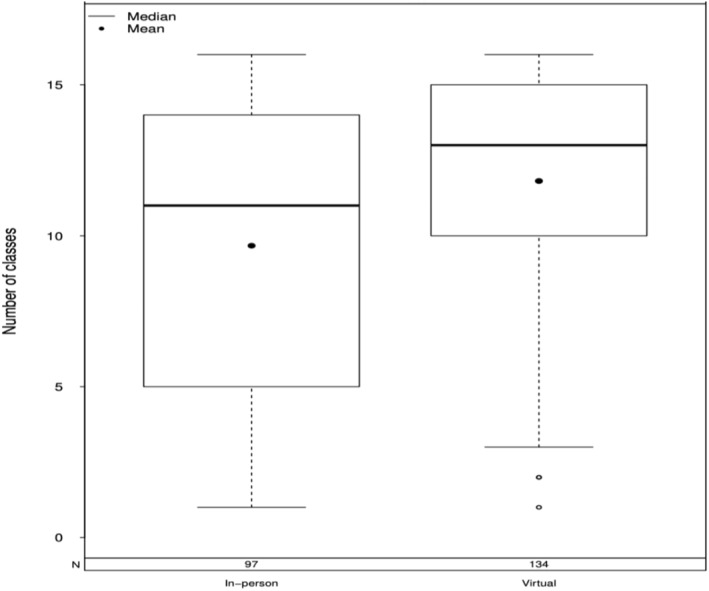
Average number of group classes attended (out of 16) for in‐person versus virtual cohorts. Box and whisker plots indicate the median (solid line), mean (dot), and interquartile range within the dimensions of the boxes.

Average number of group classes attended (out of 16) for in‐person versus virtual cohorts. Box and whisker plots indicate the median (solid line), mean (dot), and interquartile range within the dimensions of the boxes.