Figure 2.

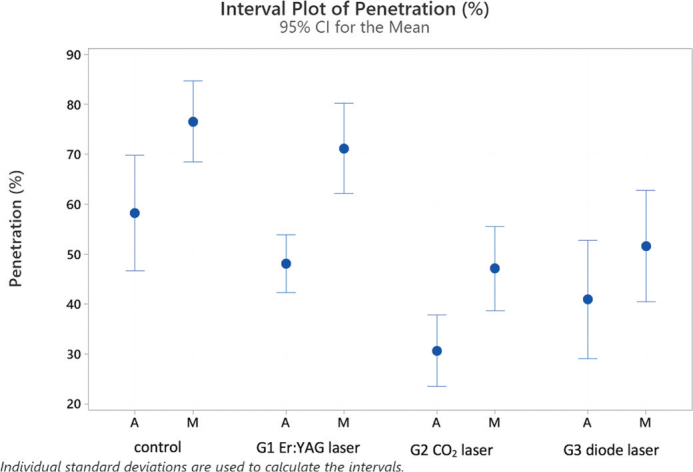
Interval plot with percentages of penetration of the sealer in laser groups 1–3 and the control group with traditional syringe irrigation, analyzed in middle (M) and apical (A) root sections.

Interval plot with percentages of penetration of the sealer in laser groups 1–3 and the control group with traditional syringe irrigation, analyzed in middle (M) and apical (A) root sections.