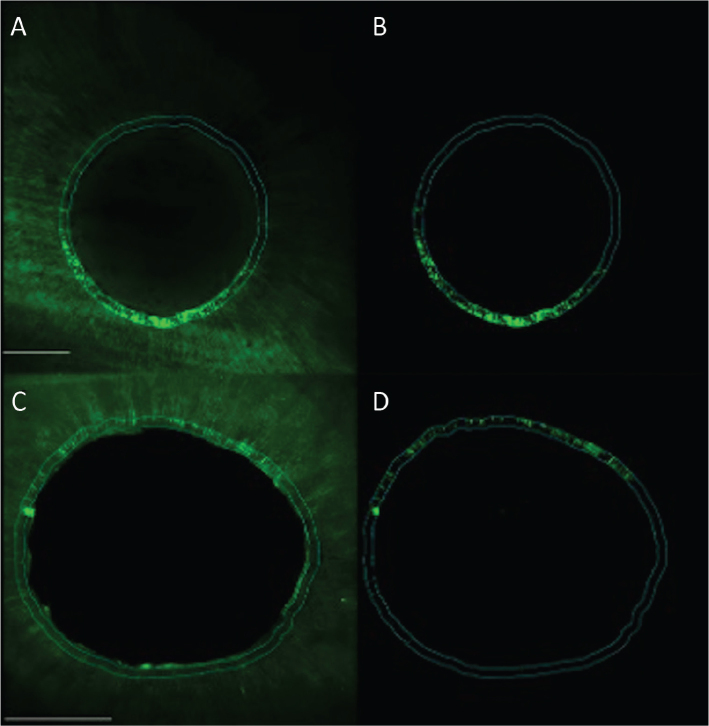
Figure 3.
Confocal images representing the microleakage along the dentin tubules for experimental groups 1 (Er:YAG) and 2 (CO2) in the apical root third. Group 1 (Er:YAG) (photo A and B) and group 2 (CO2) (photo C and D). Left images overview scan and right image with fluorescence for quantification in working area. Scale bar represents 200 µm.

