Figure 4.

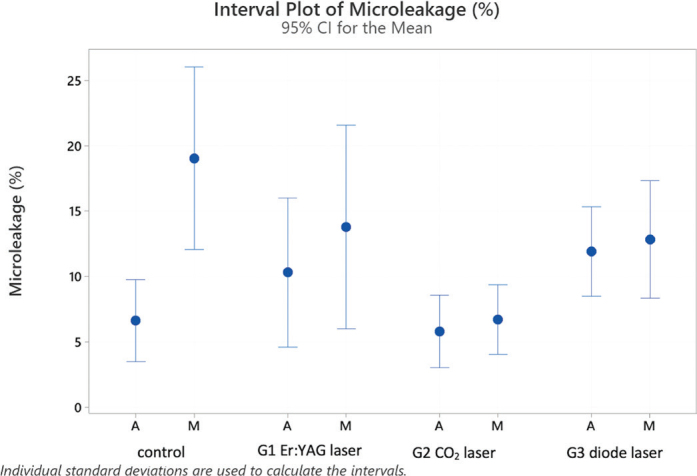
Interval plot with percentages of microleakage along the resin tags in laser groups 1–3 and the control group with traditional syringe irrigation, analyzed in middle (M) and apical (A) root sections.

Interval plot with percentages of microleakage along the resin tags in laser groups 1–3 and the control group with traditional syringe irrigation, analyzed in middle (M) and apical (A) root sections.