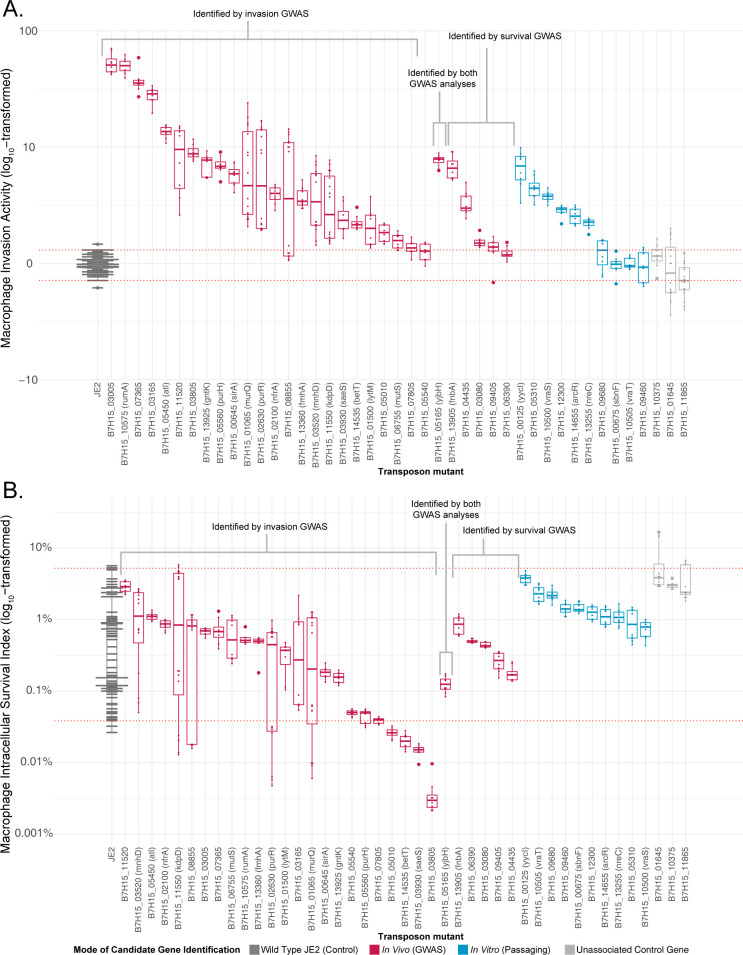
Fig 4. Transposon disruption of candidate macrophage pathogenesis genes.
Fold-difference in measurements of macrophage invasion, relative to in-batch testing of the parental JE2 strain (A), and macrophage intracellular survival (B) for specified transposon mutants. Candidate genes are grouped according to the strategy by which they were identified, and sorted within groups by median value. Values from in-run JE2 strain controls are shown, and JE2 transposon mutants in genes not implicated in macrophage pathogenesis were used as an additional control group. Boxes indicate median, 25th, and 75th percentiles with whiskers extending to the most distant value < 1.5 times the interquartile range. Red horizontal lines indicate the 95% confidence interval of all JE2 control measurements, with significant mutants defined as having a median measurement outside this range. Values higher than the 95% confidence intervals indicate increased macrophage pathogenesis phenotypes, and those below the interval correspond to decreased macrophage pathogenesis phenotypes. Genome-wide association study (GWAS).

