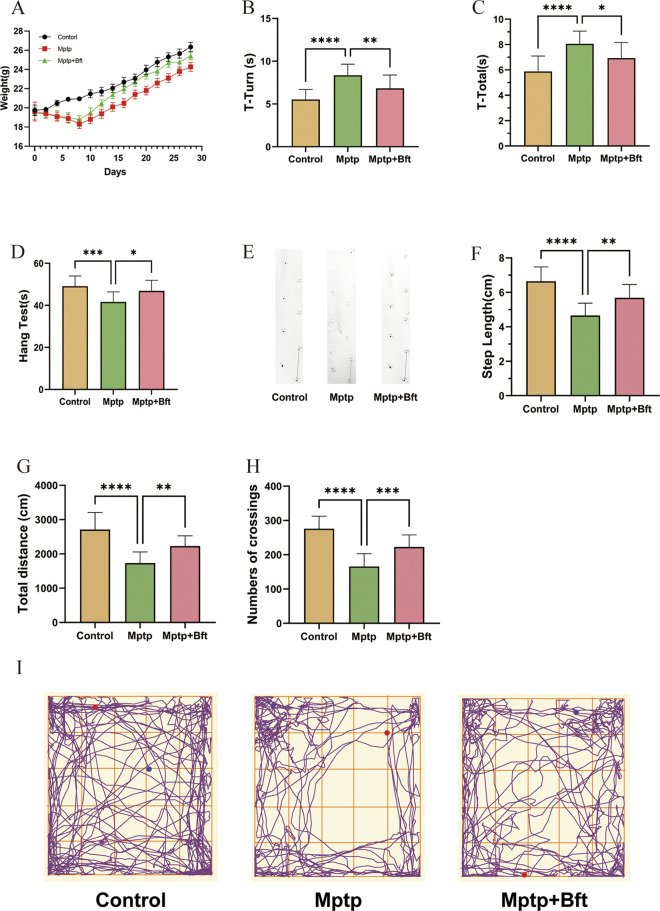
Fig 1. Effect of BFT on the behavioral properties of mice with MPTP-induced PD.
(A) Body weight changes in three groups of mice over a period of 1 months (n = 15 animals for each group). (B, C) Pole test plots of three groups of mice. The duration from when the mouse began moving to when its head completed the turn downward (T-Turn) and the overall time from when the mouse started standing on the ball to when it reached the bottom of the pole (T-Total) was noted. (D) The Hang test plot of three groups of mice. (E,F) Plots of the double hind footprints of three groups of mice, and the length of the right rear footprint line is the STEP LENGTH. (G,H) VisuTrack Animal Behavior Analysis Software was utilized for 5 minutes to track the mice’s total crawling distance and line crossings. (I) The mouse crawling trajectory diagram. (Behavioral tests, Data are expressed as mean ± SEM, n = 15, *P<0.05, **P<0.01, ***P<0.001, ****P<0.0001).

