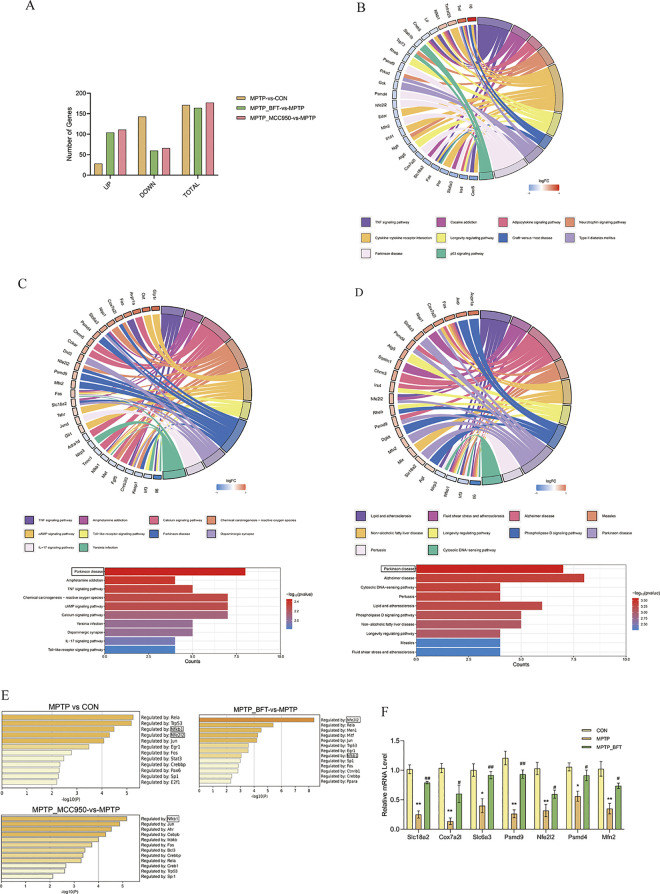
Fig 3. RNA-seq analysis reveals gene expression patterns regulated by BFT and MCC950.
(A) Bar chart of differentially expressed genes (DEGs). The X-axis represents the categories of upregulated, downregulated, and total genes, while the Y-axis represents the corresponding number of DEGs. (B) KEGG pathway enrichment chord plot (MPTP-vs-CON). (C) KEGG enrichment analysis plot (MPTP_BFT vs MPTP). (D) Enrichment analysis of differentially expressed genes in the intersecting region of MPTP vs CON and MPTP_BFT vs MPTP comparison groups. String plots showing the pathways enriched for differential genes and the relative expression abundance of the differential genes associated with each pathway. Red: up-regulated genes, blue: down-regulated genes. Differential gene enrichment of KEGG signaling pathways, with -logl0 (P value) defining the top 10 significantly enriched KEGG pathways. (E) Summary of transcription factor enrichment analysis in Metascape (TRRUST). Upstream regulatory transcription factors of differentially expressed genes in each comparison group were analyzed, defining the enrichment level as -log10(P value). A higher value indicates a more critical regulatory role, the greater the value, the more crucial the regulation. (F) qPCR (quantitative real-time polymerase chain reaction) validation of key genes. After BFT intervention, there were relative mRNA level changes in key signaling pathways related to differential genes. n = 3, MPTP vs CON, **P<0.01 and *P<0.05, MPTP_BFT vs MPTP, ## P<0.01 and # P<0.05.

