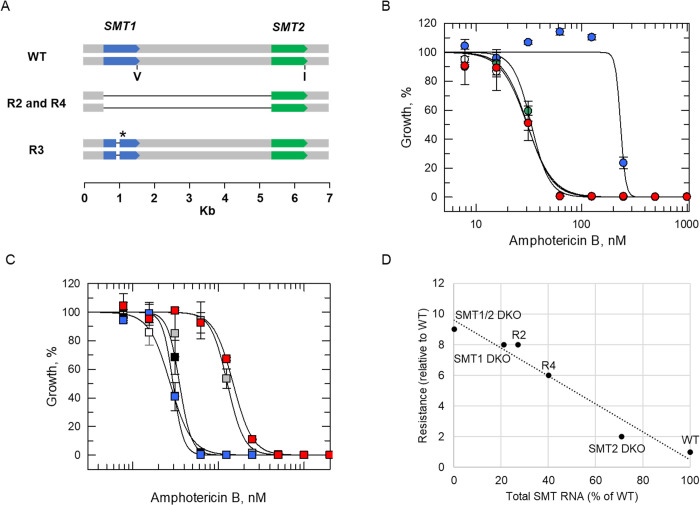
Fig 3. Investigating the impact of SMT1 and SMT2 deletions on AmB susceptibility.
(A) Schematic representation of SMT1-related deletions identified in AmB R2–4 cell lines. The site of the single amino acid change between SMT1 (V indicating valine) and SMT2 (I indicating isoleucine) are shown. The site of the new stop codon in AmB R3 is denoted by an asterisk. (B) Dose-response curves for WT (white), AmB R3 (blue), AmB R3 plus SMT1WT add-back (green) and AmB R3 plus SMT2WT add-back (red) clones treated with AmB. EC50 values of 30 ± 1, 234 ± 36, 33 ± 2 and 31 ± 1 nM were determined for WT, AmB R3, AmB R3 plus SMT1WT add-back and AmB R3 plus SMT2WT add-back promastigotes, respectively. (C) Dose-response curves for WT (white), SMT1 SKO (black), SMT1 DKO (grey), SMT2 DKO (blue), and SMT1/2 DKO (red). EC50 values of 28 ± 1, 35 ± 1, 128 ± 6, 30 ± 0.6 and 149 ± 4 nM were determined for WT, SMT1 SKO, SMT1 DKO, SMT2 DKO, and SMT1/2 DKO promastigotes, respectively. These EC50 curves and values represent one biological replicate, composed of two technical replicates. Collated datasets reporting the weighted mean ± SD of multiple biological replicates are summarised in Table 1. (D) Plot of total SMT RNA versus level of AmB resistance, relative to WT.

