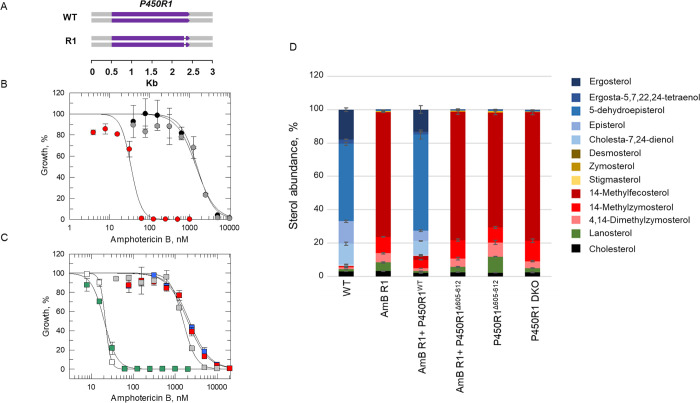
Fig 4. Investigating the impact of P450R1 functional loss on AmB susceptibility and sterol composition.
(A) Schematic representation of the homozygous 24-bp deletion within P450R1 in the AmB R1 cell line. (B) Dose–response curves for AmB R1 (grey), AmB R1 plus P450R1WT add-back (red) and AmB R1 plus P450R1Δ605–612 add-back (black) promastigote clones treated with AmB. EC50 values of 1530 ± 116, 34 ± 3.9, and 1450 ± 211 nM were determined for AmB R1, AmB R1 plus P450R1WT add-back, and AmB-R1 plus P450R1Δ605–612 addback, respectively. (C) Dose-response curves for WT (white), P450R1 DKO (blue), P450R1 DKO plus P450R1WT add-back (green), P450R1 DKO plus P450R1 Δ605–612 add-back (red) and P450R1Δ605–612 (grey) promastigotes treated with AmB. EC50 values of 22 ± 0.1, 2170 ± 204, 20 ± 0.7, 1990 ± 193 and 1550 ± 99 nM were determined for WT, P450R1 DKO, P450R1 DKO plus P450R1WT add-back, P450R1 DKO plus P450R1Δ605–612 add-back and P450R1Δ605–612 promastigotes, respectively. These EC50 curves and values represent one biological replicate, composed of two technical replicates. Collated datasets reporting the weighted mean ± SD of multiple biological replicates are summarised in Table 1. (D) Sterol profiling of WT and P450R1 mutant promastigotes. Values are the mean ± SD from biological replicates.

