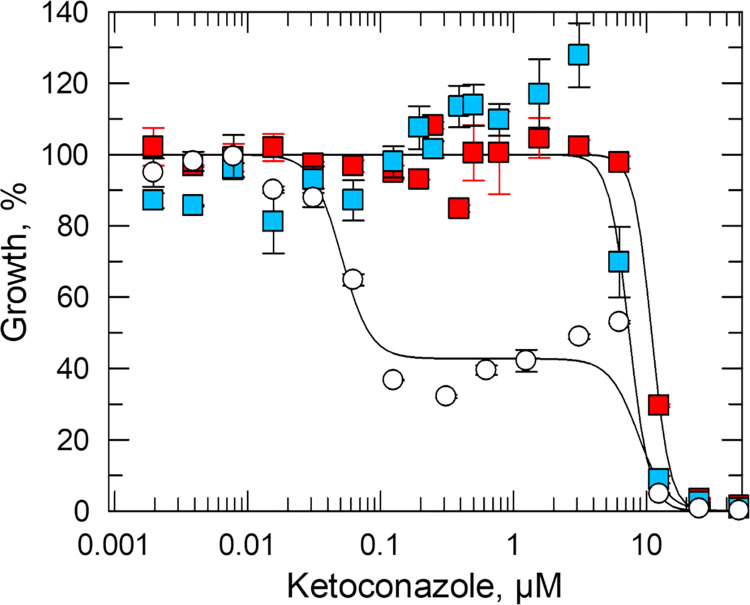
Fig 5. Investigating the impact of P450R1 and CYP51 functional loss on ketoconazole susceptibility.
Dose–response curves for WT (white), CYP51 DKO (blue) and P450R1 DKO (red) promastigote clones treated with ketoconazole. EC50 values of 0.03 ± 0.01 (lower) and 10 ± 8 μM (upper) were determined for WT promastigotes while values of 11 ± 3 and 7 ± 1 μM were determined for P450R1 DKO and CYP51 DKO parasites, respectively. These EC50 curves and values represent one biological replicate, composed of two technical replicates. Collated datasets reporting the weighted mean ± SD of multiple biological replicates are summarised in S8 Table.

