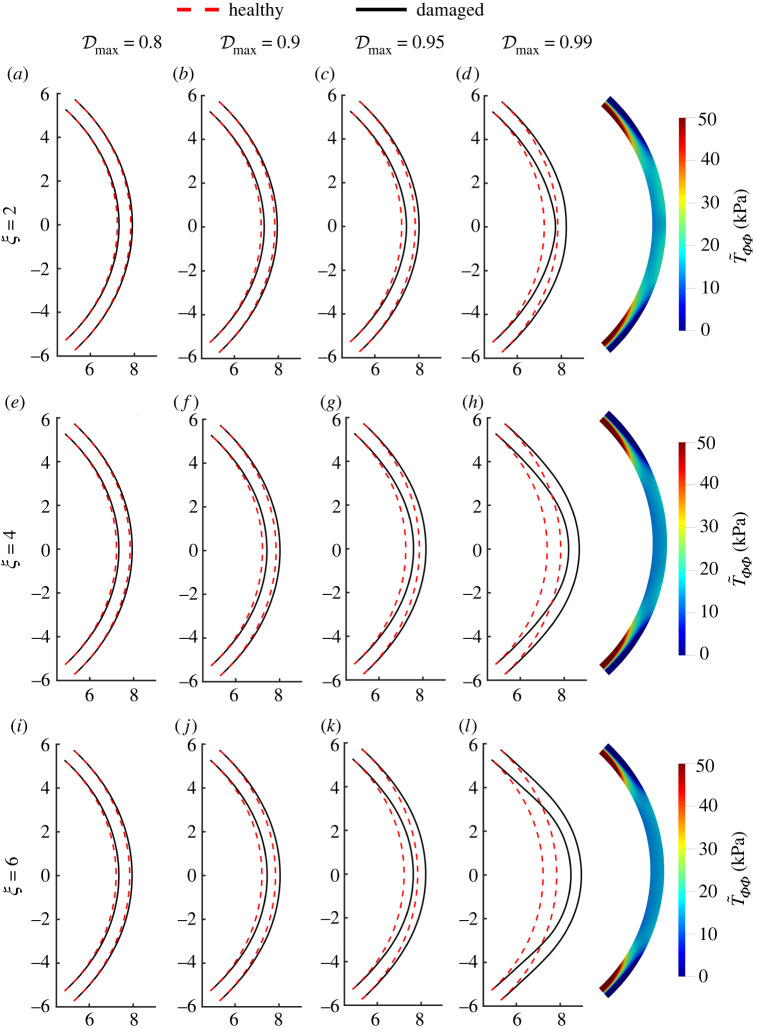
Figure 5.
Predicted diseased corneal shapes using the continuum model with the parabolic (ξ = 2 in (4.2)); (a–d), quartic (ξ = 4; e–h) and sextic (ξ = 6; i–l) damage profiles and varying value of central damage (first column), 0.9 (second column), 0.95 (third column), 0.99 (fourth column). Panels on the right show the circumferential stress at for the three considered values of ξ—this can be compared with the healthy profile in figure 3h.

