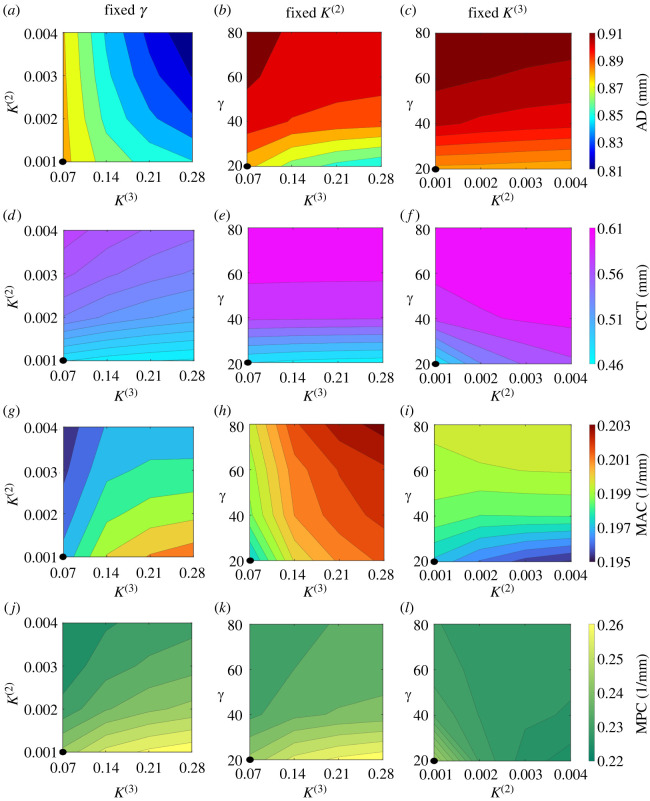
Figure 8.
Comparison of key metrics of diseased corneas (using and ξ = 4 in (4.2)) for varying γ, K(2) and K(3). In left, central and right panels, we fix at their baseline values γ, K(2) and K(3), respectively, and vary the remaining parameters. We plot the apex displacement (AD; a–c), the central corneal thickness (CCT; d–f), the maximum anterior curvature (MAC; g–i) and the maximum posterior curvature (MPC; j–k). For comparison, we note that the reference (unloaded cornea) values are AD=0 mm, CCT=0.62 mm, , and the values for healthy cornea loaded with physiological IOP are AD=0.04 mm, CCT=0.617 mm, MAC = 0.131 mm−1 and MPC = 0.143 mm−1. Black circles at bottom-left corners of the panels indicate the case where all parameters are fixed at their baseline values (γ = 20, K(2) = 0.001 and K(3) = 0.07).

