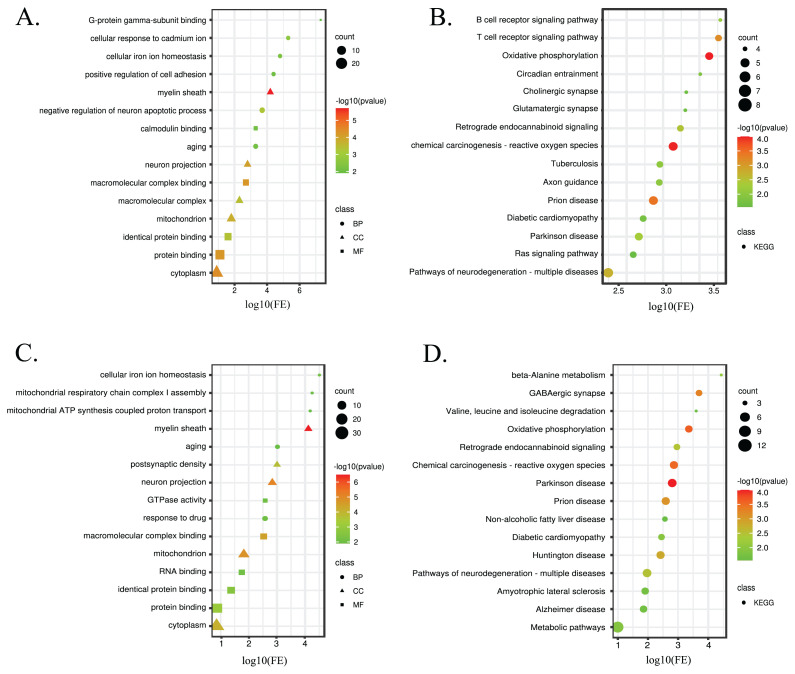
Figure 3.
Enrichment analyses of LODG and HODG compared to ALZ are represented in bubble plots. (A) GO analysis and (B) KEGG pathway analysis of DEPs in LODG. (C) GO analysis and (D) KEGG pathway analysis of DEPs in HODG. The GO/KEGG terms are represented on the y-axis. The x-axis showed the fold of enrichment. In the GO analysis plot, circle, triangle, and square represent biological process (BP), cellular component (CC), and molecular function (MF), respectively. The size of the symbol denotes the number of protein-coding genes associated with a given term. The color represents the altered p-value (−log10).

