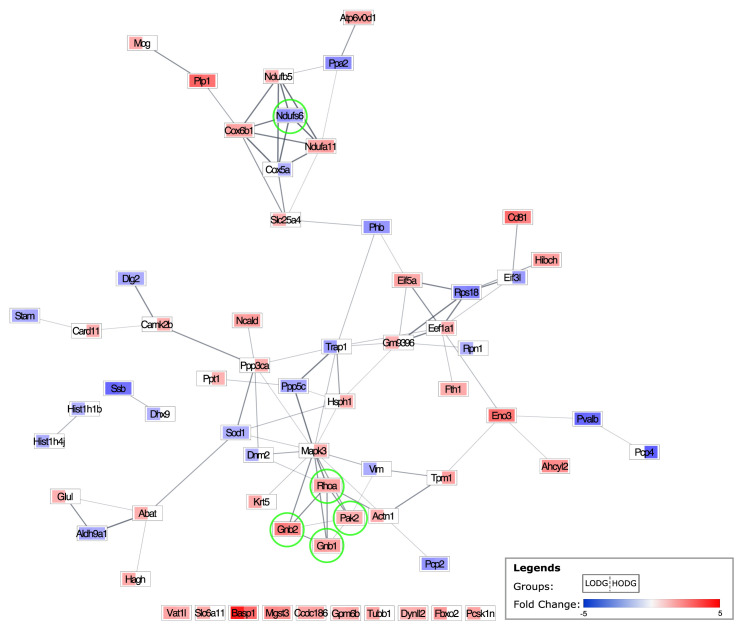
Figure 4.
The protein-protein interaction network map of the DEPs in the LODG and HODG groups in comparison to the ALZ group, individually. Each node represents a DEP. The left and right side of the rectangle represents the LODG vs. ALZ, and HODG vs. ALZ, respectively. The upregulation of a DEP is represented in red, and downregulation in blue. The lightness and darkness of the color change gradually due to the fold change (min:−5, max: 5). The white color indicates that protein is not differentially expressed in the given group. The top 5 hub DEPs are indicated with light green circles.

