Table 1.
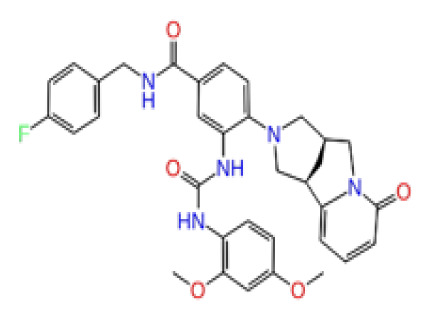
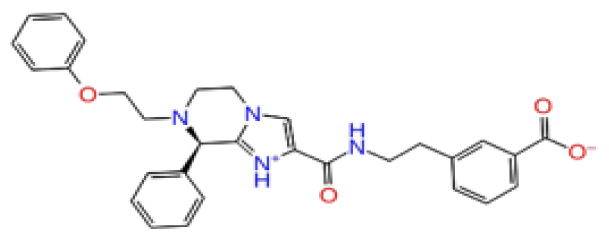
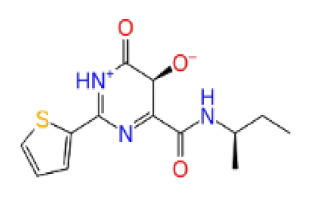
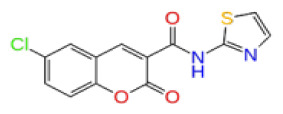
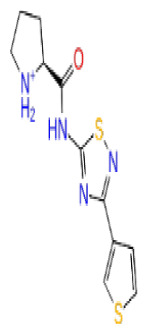
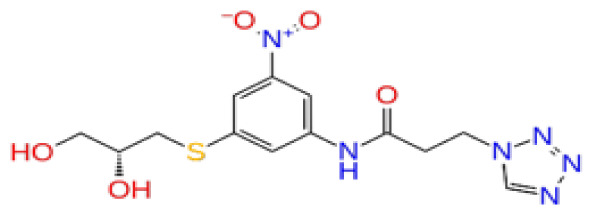
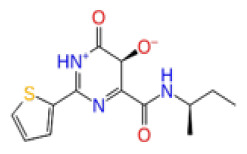
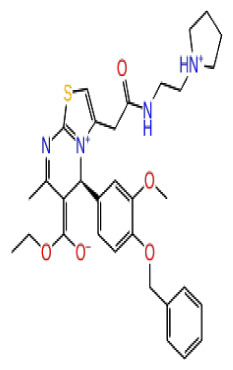
Docking scores, average MM/GBSA scores, and anticancer therapeutic activity prediction values for top-scoring compounds in the ERCC1 protein binding sites 1, 2, and 3.
| ERCC1 | ||||||||||||
|---|---|---|---|---|---|---|---|---|---|---|---|---|
| 2D Structure | Ligand ID | Library | Anticancer activity prediction | Docking score (kcal/mol) | Post-VSW MM/GBSA average score (kcal/mol) | Short MD (10 ns) MM/GBSA average score (kcal/mol) | STDEV (10 ns) | Long MD (100 ns) MM/GBSA average score (kcal/mol) | STDEV (100 ns) | Long MD (200 ns) MM/GBSA average score (kcal/mol) | STDEV (200 ns) | |
| Site 1 |
|
K786-1161 | CHEMDIV | 0.74 | −6.26 | −61.71 | −73.77 | 9.36 | −80.21 | 10.03 | −92.09 | 14.94 |

|
Z2482664935 | Enamine | 0.77 | −7.01 | −68.83 | −76.40 | 6.96 | −78.12 | 6.51 | −81.05 | 7.58 | |
|
ZC46-0211 | CHEMDIV | 0.62 | −6.65 | −62.82 | −73.10 | 6.46 | −67.69 | 9.85 | −69.30 | 9.55 | |
|
CHEMBL3617209 | CHEMBL | 0.83 | −2.97 | −31.33 | −29.34 | 7.92 | −41.86 | 5.69 | −40.08 | 6.00 | |
| Site 2 |
|
K219-1359 | CHEMDIV | 0.51 | −5.40 | −46.36 | −56.49 | 6.40 | −57.56 | 4.23 | −61.11 | 7.03 |
|
Z1450326974 | Enamine | 0.69 | −5.56 | −40.27 | −57.03 | 7.67 | −62.32 | 5.29 | −60.70 | 5.30 | |
|
Y501-9249 | CHEMDIV | 0.74 | −5.24 | −42.34 | −61.38 | 7.34 | −54.34 | 8.26 | −52.51 | 7.21 | |
|
CHEMBL3617209 | CHEMBL | 0.69 | −4.72 | −29.43 | −39.10 | 7.29 | −44.12 | 6.75 | NA | NA | |
| Site 3 |
|
V019-9483 | CHEMDIV | 0.64 | −5.92 | −52.11 | −57.71 | 9.10 | −70.97 | 13.99 | −66.36 | 11.47 |

|
D264-0862 | CHEMDIV | 0.58 | −5.85 | −58.31 | −60.17 | 4.48 | −61.98 | 5.05 | −61.44 | 6.00 | |
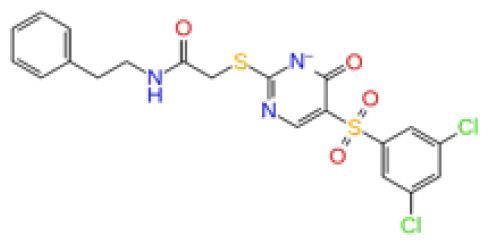
|
G605-0598 | CHEMDIV | 0.71 | −5.71 | −62.81 | −60.36 | 6.14 | −61.88 | 10.87 | −55.30 | 10.53 | |
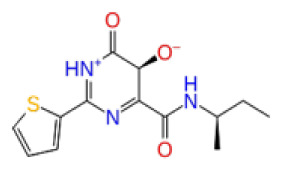
|
CHEMBL3617209 | CHEMBL | 0.83 | −2.97 | −31.33 | −29.34 | 4.06 | −28.34 | 4.18 | NA | NA | |
