Table 3.
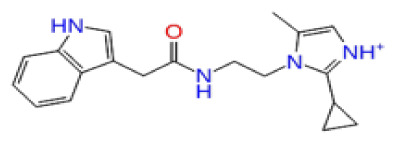
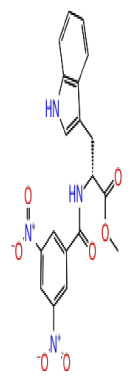
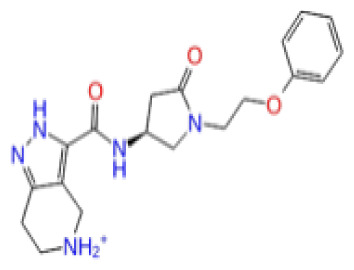
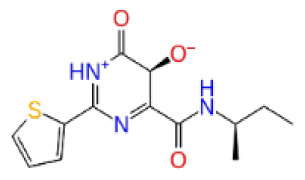
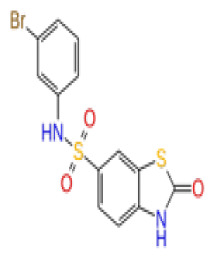
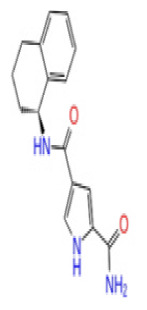
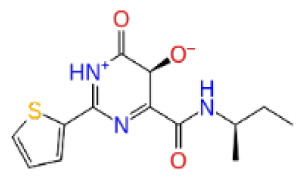
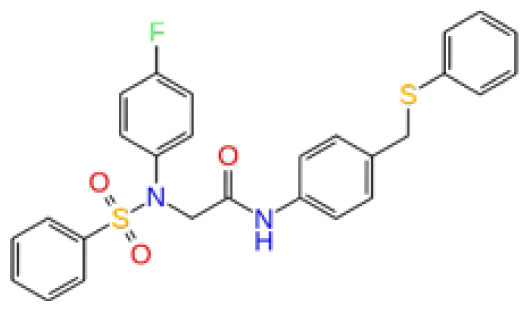
Docking scores, average MM/GBSA scores, and anti-cancer therapeutic activity prediction values for top-scoring compounds in the XPF protein binding sites 1, 2, and 3.
| XPF | ||||||||||||
|---|---|---|---|---|---|---|---|---|---|---|---|---|
| 2D Structure | Ligand ID | Library | Anticancer Activity Prediction | Docking Score (kcal/mol) | Post-VSW MM/GBSA Average Score (kcal/mol) | Short MD (10 ns) MM/GBSA Average Score (kcal/mol) | STDEV (10 ns) | Long MD (100 ns) MM/GBSA Average Score (kcal/mol) | STDEV (100 ns) | Long MD (200 ns) MM/GBSA Average Score (kcal/mol) | STDEV (200 ns) | |
| Site 1 |
|
S751-0309 | CHEMDIV | 0.76 | −7.68 | −69.28 | −77.41 | 6.94 | −73.60 | 6.30 | −71.82 | 7.64 |
|
AF-399/33695064 | SPECS | 0.71 | −6.74 | −62.60 | −73.71 | 8.58 | −68.87 | 7.96 | −65.29 | 8.42 | |
|
Z1780715778 | Enamine | 0.67 | −7.34 | −76.95 | −78.16 | 5.78 | −62.79 | 11.10 | −61.72 | 10.72 | |
|
CHEMBL3617209 | CHEMBL | 0.83 | −4.19 | −43.98 | −52.86 | 5.38 | −53.35 | 5.19 | −52.53 | 6.22 | |
| Site 2 |

|
Y020-2805 | CHEMDIV | 0.70 | −5.72 | −50.37 | −55.27 | 5.97 | −58.28 | 9.26 | −56.98 | 9.24 |
|
F818-0233 | CHEMDIV | 0.76 | −5.35 | −50.98 | −56.34 | 6.82 | −53.13 | 9.18 | −54.10 | 8.24 | |
|
Z605272712 | Enamine | 0.70 | −5.88 | −41.79 | −55.18 | 7.22 | −46.93 | 6.31 | −44.51 | 5.77 | |
|
CHEMBL3617209 | CHEMBL | 0.83 | −3.00 | −28.61 | −33.98 | 7.38 | −53.92 | 16.30 | NA | NA | |
| Site 3 |
|
AH-487/40936989 | SPECS | 0.53 | −7.09 | −76.90 | −81.14 | 8.66 | −96.65 | 6.78 | −97.30 | 6.66 |
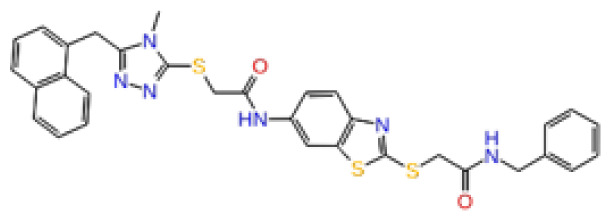
|
AN-988/40787604 | SPECS | 0.70 | −7.51 | −82.64 | −86.60 | 8.12 | −89.70 | 8.64 | −87.94 | 10.33 | |
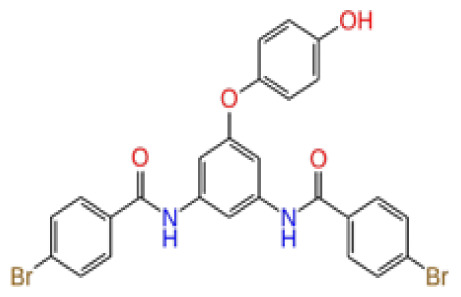
|
Y500-0018 | CHEMDIV | 0.71 | −7.82 | −81.60 | −82.48 | 6.51 | −85.87 | 7.47 | −86.17 | 8.63 | |
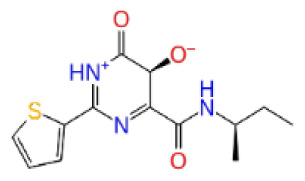
|
CHEMBL3617209 | CHEMBL | 0.83 | −2.65 | −38.50 | −31.32 | 7.99 | −44.20 | 4.75 | NA | NA | |
